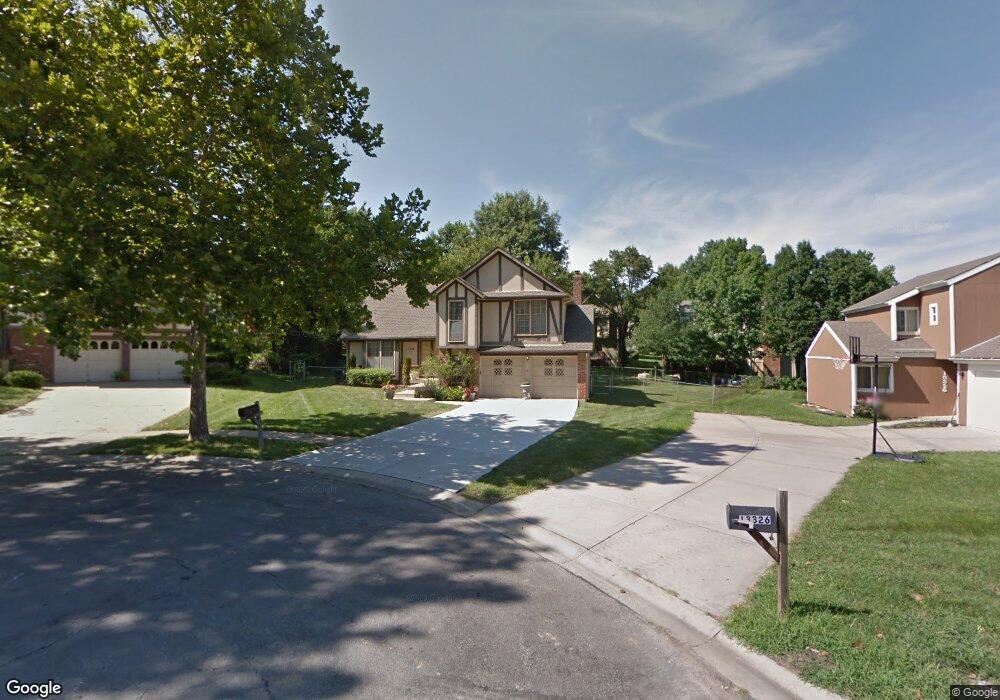
13330 W 104th Ct Lenexa, KS 66215
Oak Park NeighborhoodEstimated Value: $396,421 - $412,000
4
Beds
3
Baths
1,604
Sq Ft
$253/Sq Ft
Est. Value
About This Home
This home is located at 13330 W 104th Ct, Lenexa, KS 66215 and is currently estimated at $405,355, approximately $252 per square foot. 13330 W 104th Ct is a home located in Johnson County with nearby schools including Rosehill Elementary School, Indian Woods Middle School, and Shawnee Mission South High School.
Create a Home Valuation Report for This Property
The Home Valuation Report is an in-depth analysis detailing your home's value as well as a comparison with similar homes in the area
Home Values in the Area
Average Home Value in this Area
Tax History Compared to Growth
Tax History
| Year | Tax Paid | Tax Assessment Tax Assessment Total Assessment is a certain percentage of the fair market value that is determined by local assessors to be the total taxable value of land and additions on the property. | Land | Improvement |
|---|---|---|---|---|
| 2024 | $4,229 | $38,307 | $7,932 | $30,375 |
| 2023 | $4,226 | $37,525 | $7,551 | $29,974 |
| 2022 | $3,812 | $33,810 | $6,868 | $26,942 |
| 2021 | $3,484 | $29,256 | $6,239 | $23,017 |
| 2020 | $3,357 | $27,899 | $5,675 | $22,224 |
| 2019 | $3,199 | $26,554 | $4,730 | $21,824 |
| 2018 | $3,094 | $25,450 | $4,730 | $20,720 |
| 2017 | $3,038 | $24,219 | $4,296 | $19,923 |
| 2016 | $2,870 | $22,575 | $3,924 | $18,651 |
| 2015 | $2,747 | $21,747 | $3,924 | $17,823 |
| 2013 | -- | $20,539 | $3,924 | $16,615 |
Source: Public Records
Map
Nearby Homes
- 10474 Caenen Lake Rd
- 13401 W 105th Terrace
- 10211 Hauser St
- 13300 W 102nd St
- 10226 Gillette St
- 10220 Gillette St
- 10590 Bradshaw St
- 10184 Haskins St
- 13013 W 101st St
- 12808 W 108th St
- 10308 Westgate St
- 10331 Westgate St
- 10580 Long St
- 10566 Century Ln
- 12707 W 108th Terrace
- 12400 W 105th Terrace
- 10909 Gillette St
- 10901 Gillette St
- 12696 W 108th Terrace
- 9948 Rosehill Rd
- 13334 W 104th Ct
- 13333 W 104th St
- 13337 W 104th St
- 13326 W 104th Ct
- 13329 W 104th St
- 13338 W 104th Ct
- 13323 W 104th Ct
- 13341 W 104th St
- 10407 Haskins St
- 10411 Haskins St
- 13327 W 104th Ct
- 13321 W 104th St
- 13345 W 104th St
- 10415 Haskins St
- 10478 Caenen Lake Rd
- 13332 W 104th St
- 13336 W 104th St
- 13328 W 104th St
- 13331 W 104th Ct
- 10482 Caenen Lake Rd