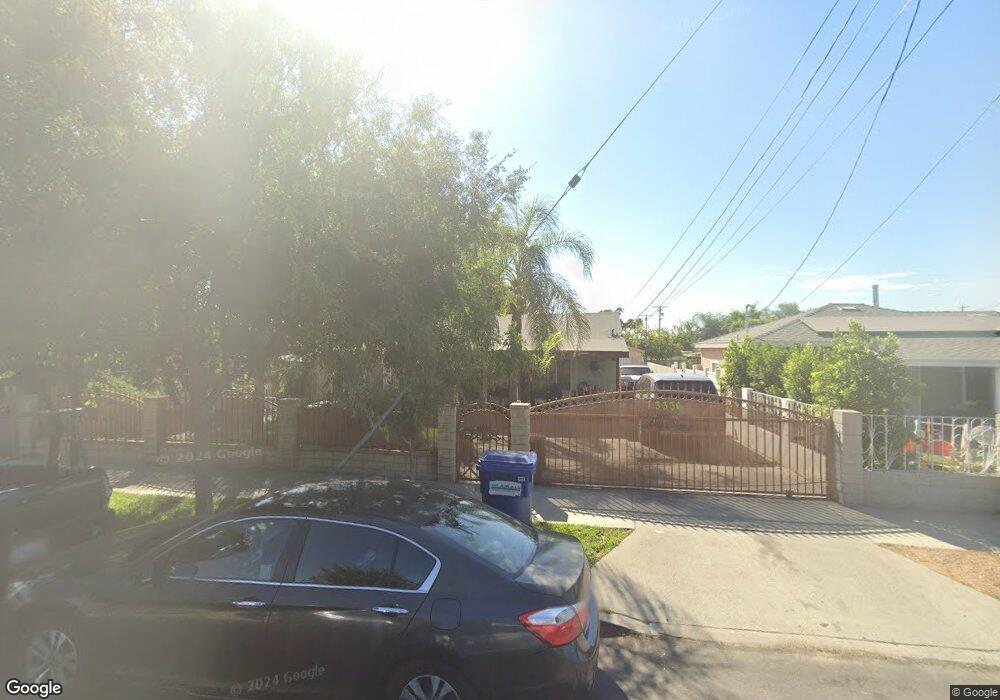
13336 Gager St Pacoima, CA 91331
Estimated Value: $629,491 - $750,000
2
Beds
1
Bath
962
Sq Ft
$716/Sq Ft
Est. Value
About This Home
This home is located at 13336 Gager St, Pacoima, CA 91331 and is currently estimated at $688,873, approximately $716 per square foot. 13336 Gager St is a home located in Los Angeles County with nearby schools including Haddon Avenue Elementary School, Pacoima Middle School, and San Fernando Senior High School.
Ownership History
Date
Name
Owned For
Owner Type
Purchase Details
Closed on
Nov 16, 2009
Sold by
Vazquez Alberto
Bought by
Vazquez Guadalupe and Medina Margarita
Current Estimated Value
Purchase Details
Closed on
Jan 10, 2008
Sold by
Vazquez Guadalupe
Bought by
Vazquez Alberto and Vazquez Guadalupe
Home Financials for this Owner
Home Financials are based on the most recent Mortgage that was taken out on this home.
Original Mortgage
$117,000
Outstanding Balance
$21,790
Interest Rate
5.96%
Mortgage Type
New Conventional
Estimated Equity
$667,083
Purchase Details
Closed on
Dec 16, 1998
Sold by
Bermea Nellie
Bought by
Vasquez Guadalupe and Medina Margarita
Home Financials for this Owner
Home Financials are based on the most recent Mortgage that was taken out on this home.
Original Mortgage
$99,847
Interest Rate
6.63%
Mortgage Type
FHA
Create a Home Valuation Report for This Property
The Home Valuation Report is an in-depth analysis detailing your home's value as well as a comparison with similar homes in the area
Home Values in the Area
Average Home Value in this Area
Purchase History
| Date | Buyer | Sale Price | Title Company |
|---|---|---|---|
| Vazquez Guadalupe | -- | Accommodation | |
| Vazquez Alberto | -- | First American Title Company | |
| Vasquez Guadalupe | $100,000 | Investors Title Company | |
| Vasquez Guadalupe | -- | Investors Title Company |
Source: Public Records
Mortgage History
| Date | Status | Borrower | Loan Amount |
|---|---|---|---|
| Open | Vazquez Alberto | $117,000 | |
| Closed | Vasquez Guadalupe | $99,847 |
Source: Public Records
Tax History Compared to Growth
Tax History
| Year | Tax Paid | Tax Assessment Tax Assessment Total Assessment is a certain percentage of the fair market value that is determined by local assessors to be the total taxable value of land and additions on the property. | Land | Improvement |
|---|---|---|---|---|
| 2025 | $2,112 | $429,860 | $290,980 | $138,880 |
| 2024 | $2,112 | $153,671 | $88,208 | $65,463 |
| 2023 | $2,076 | $150,659 | $86,479 | $64,180 |
| 2022 | $1,985 | $147,706 | $84,784 | $62,922 |
| 2021 | $1,958 | $144,811 | $83,122 | $61,689 |
| 2019 | $1,903 | $140,517 | $80,657 | $59,860 |
| 2018 | $1,800 | $137,763 | $79,076 | $58,687 |
| 2016 | $1,712 | $132,415 | $76,006 | $56,409 |
| 2015 | $1,689 | $130,427 | $74,865 | $55,562 |
| 2014 | $1,704 | $127,873 | $73,399 | $54,474 |
Source: Public Records
Map
Nearby Homes
- 10226 Amboy Ave
- 10200 Rincon Ave
- 13154 Garber St
- 9076 9078 Lev Ave
- 10397 San Fernando
- 13200 Glamis St
- 13365 Garber St
- 10615 San Fernando Rd
- 13032 Glamis St
- 13541 Pinney St
- 10321 Laurel Canyon Blvd
- 12985 Kagel Canyon St
- 13039 Kelowna St
- 13059 Pierce St
- 13722 Pierce St
- 13426 Mercer St
- 13046 Kelowna St
- 13737 Mercer St
- 13762 Judd St
- 13700 Filmore St
- 13342 Gager St
- 13332 Gager St
- 13346 Gager St
- 13352 Gager St
- 13307 Gain St
- 13303 Gain St
- 13313 Gain St
- 13317 Gain St
- 13356 Gager St
- 10348 Kewen Ave
- 10352 Kewen Ave
- 13337 Gager St
- 13327 Gain St
- 10344 Kewen Ave
- 13343 Gager St
- 13333 Gager St
- 10358 Kewen Ave
- 13347 Gager St
- 10338 Kewen Ave
- 10362 Kewen Ave