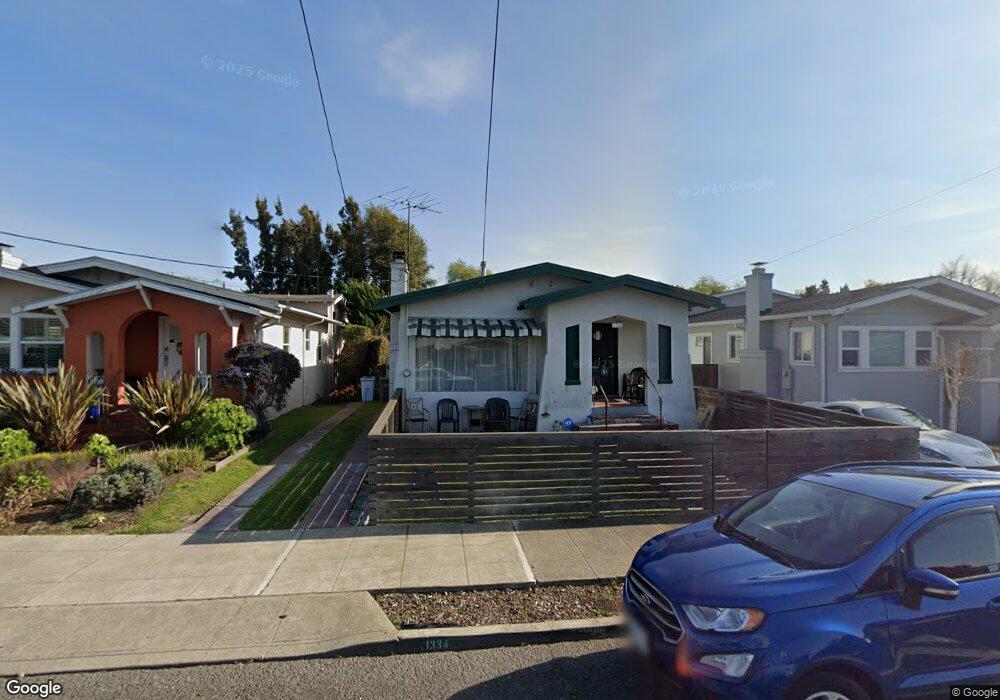
1334 67th St Berkeley, CA 94702
West Berkeley NeighborhoodEstimated Value: $885,204 - $1,077,000
3
Beds
1
Bath
1,067
Sq Ft
$922/Sq Ft
Est. Value
About This Home
This home is located at 1334 67th St, Berkeley, CA 94702 and is currently estimated at $983,551, approximately $921 per square foot. 1334 67th St is a home located in Alameda County with nearby schools including Malcolm X Elementary School, Washington Elementary School, and Oxford Elementary School.
Ownership History
Date
Name
Owned For
Owner Type
Purchase Details
Closed on
May 13, 2005
Sold by
Jones Antoine and Jones Charisse Rachelle
Bought by
Jones Antoine and Jones Charisse Rachelle
Current Estimated Value
Home Financials for this Owner
Home Financials are based on the most recent Mortgage that was taken out on this home.
Original Mortgage
$336,000
Outstanding Balance
$188,583
Interest Rate
7.05%
Mortgage Type
Purchase Money Mortgage
Estimated Equity
$794,968
Purchase Details
Closed on
Mar 27, 1995
Sold by
Emc Mtg Corp
Bought by
Jones Antione and Jones Charisse Rachelle
Purchase Details
Closed on
Oct 1, 1994
Sold by
Great Western Bank
Bought by
Emc Mtg Corp
Purchase Details
Closed on
Sep 16, 1994
Sold by
Great Western Bank
Bought by
Great Western Bank
Create a Home Valuation Report for This Property
The Home Valuation Report is an in-depth analysis detailing your home's value as well as a comparison with similar homes in the area
Home Values in the Area
Average Home Value in this Area
Purchase History
| Date | Buyer | Sale Price | Title Company |
|---|---|---|---|
| Jones Antoine | -- | North American Title Co | |
| Jones Antione | $125,000 | Chicago Title Company | |
| Emc Mtg Corp | $87,500 | -- | |
| Great Western Bank | $83,833 | -- |
Source: Public Records
Mortgage History
| Date | Status | Borrower | Loan Amount |
|---|---|---|---|
| Open | Jones Antoine | $336,000 |
Source: Public Records
Tax History
| Year | Tax Paid | Tax Assessment Tax Assessment Total Assessment is a certain percentage of the fair market value that is determined by local assessors to be the total taxable value of land and additions on the property. | Land | Improvement |
|---|---|---|---|---|
| 2025 | $5,619 | $202,950 | $62,985 | $146,965 |
| 2024 | $5,619 | $198,834 | $61,750 | $144,084 |
| 2023 | $5,433 | $201,800 | $60,540 | $141,260 |
| 2022 | $5,456 | $190,843 | $59,353 | $138,490 |
| 2021 | $5,439 | $186,964 | $58,189 | $135,775 |
| 2020 | $5,130 | $191,975 | $57,592 | $134,383 |
| 2019 | $4,885 | $188,211 | $56,463 | $131,748 |
| 2018 | $4,758 | $184,521 | $55,356 | $129,165 |
| 2017 | $4,564 | $180,904 | $54,271 | $126,633 |
| 2016 | $4,352 | $177,358 | $53,207 | $124,151 |
| 2015 | $4,270 | $174,694 | $52,408 | $122,286 |
| 2014 | $4,197 | $171,273 | $51,382 | $119,891 |
Source: Public Records
Map
Nearby Homes
- 6628 Helen Ct
- 1080 67th St
- 3032 Mabel St
- 3224 Sacramento St
- 3101 Sacramento St
- 6500 San Pablo Ave
- 1507 Prince St
- 1314 Ashby Ave
- 6501 San Pablo Ave Unit 410
- 6465 San Pablo Ave Unit 203
- 3138 California St
- 968 62nd St
- 3114 California St
- 1126 Ocean Ave
- 3214 California St
- 3110 California St
- 1237 Ashby Ave
- 2922 Stanton St
- 1164 Ocean Ave
- 1124 63rd St
Your Personal Tour Guide
Ask me questions while you tour the home.