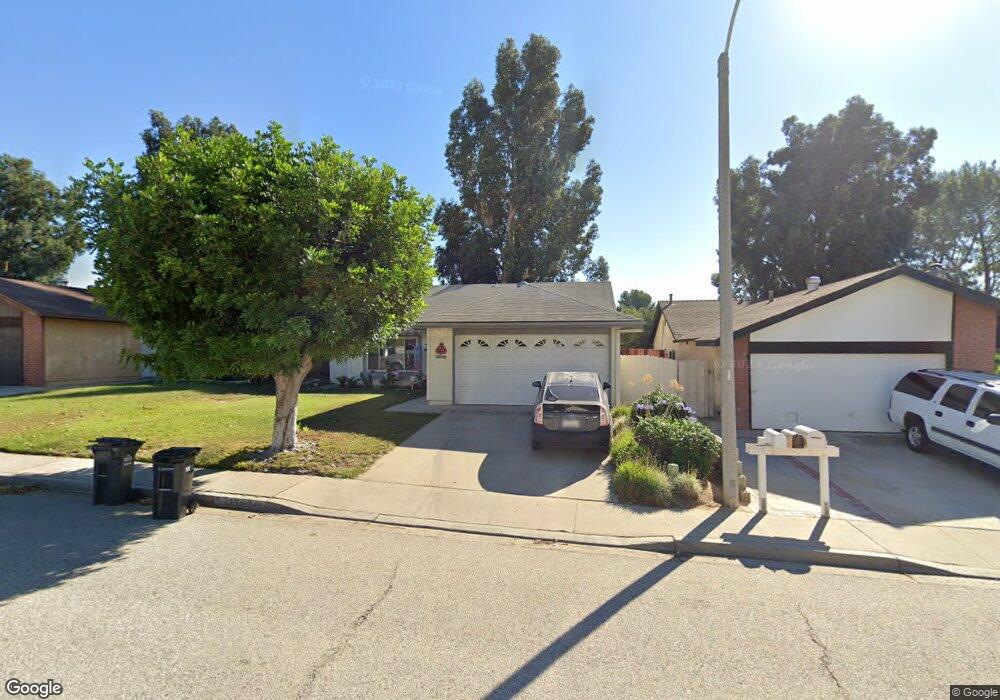
13340 E Quail Summit Rd Moorpark, CA 93021
Estimated Value: $792,012 - $817,000
4
Beds
2
Baths
1,310
Sq Ft
$614/Sq Ft
Est. Value
About This Home
This home is located at 13340 E Quail Summit Rd, Moorpark, CA 93021 and is currently estimated at $803,753, approximately $613 per square foot. 13340 E Quail Summit Rd is a home located in Ventura County with nearby schools including Peach Hill Academy, Mesa Verde Middle School, and Moorpark High School.
Ownership History
Date
Name
Owned For
Owner Type
Purchase Details
Closed on
Mar 26, 1999
Sold by
Keirstead David
Bought by
Keirstead David Mark and Keirstead Diedra Lynn
Current Estimated Value
Home Financials for this Owner
Home Financials are based on the most recent Mortgage that was taken out on this home.
Original Mortgage
$203,700
Outstanding Balance
$49,216
Interest Rate
6.73%
Estimated Equity
$754,537
Purchase Details
Closed on
Mar 24, 1999
Sold by
Keirstead Diedra Lynn
Bought by
Keirstead David
Home Financials for this Owner
Home Financials are based on the most recent Mortgage that was taken out on this home.
Original Mortgage
$203,700
Outstanding Balance
$49,216
Interest Rate
6.73%
Estimated Equity
$754,537
Purchase Details
Closed on
Mar 3, 1999
Sold by
Kieu Hoang
Bought by
Keirstead David
Home Financials for this Owner
Home Financials are based on the most recent Mortgage that was taken out on this home.
Original Mortgage
$203,700
Outstanding Balance
$49,216
Interest Rate
6.73%
Estimated Equity
$754,537
Create a Home Valuation Report for This Property
The Home Valuation Report is an in-depth analysis detailing your home's value as well as a comparison with similar homes in the area
Home Values in the Area
Average Home Value in this Area
Purchase History
| Date | Buyer | Sale Price | Title Company |
|---|---|---|---|
| Keirstead David Mark | -- | Fidelity National Title Co | |
| Keirstead David | -- | Fidelity National Title Co | |
| Keirstead David | $210,000 | Fidelity National Title Co |
Source: Public Records
Mortgage History
| Date | Status | Borrower | Loan Amount |
|---|---|---|---|
| Open | Keirstead David | $203,700 |
Source: Public Records
Tax History
| Year | Tax Paid | Tax Assessment Tax Assessment Total Assessment is a certain percentage of the fair market value that is determined by local assessors to be the total taxable value of land and additions on the property. | Land | Improvement |
|---|---|---|---|---|
| 2025 | $3,582 | $329,186 | $131,673 | $197,513 |
| 2024 | $3,582 | $322,732 | $129,091 | $193,641 |
| 2023 | $3,503 | $316,404 | $126,559 | $189,845 |
| 2022 | $3,412 | $310,200 | $124,077 | $186,123 |
| 2021 | $3,405 | $304,118 | $121,644 | $182,474 |
| 2020 | $3,373 | $301,002 | $120,398 | $180,604 |
| 2019 | $3,298 | $295,101 | $118,038 | $177,063 |
| 2018 | $3,264 | $289,316 | $115,724 | $173,592 |
| 2017 | $3,196 | $283,644 | $113,455 | $170,189 |
| 2016 | $3,136 | $278,083 | $111,231 | $166,852 |
| 2015 | $3,093 | $273,908 | $109,561 | $164,347 |
| 2014 | $3,010 | $268,545 | $107,416 | $161,129 |
Source: Public Records
Map
Nearby Homes
- 13191 Honeybee St
- 13611 Bear Valley Rd
- 13142 E Mesa Verde Dr
- 4520 N Ashtree St
- 4487 Cedar Branch Ct
- 13754 Bear Valley Rd
- 13709 Grand Isle Dr
- 4067 Weeping Willow Dr
- 13761 Donnybrook Ln
- 13133 Thomasville Ct
- 12610 Hillside Dr
- 13223 Norfolk Ct
- 12564 Spring Creek Rd
- 4630 Rio Bravo Ct
- 4578 Big Country Ct
- 12576 Cherry Grove St
- 14158 Oneida Ct
- 13418 Nightsky Dr
- 12157 London Grove Ct
- 12120 London Grove Ct
- 13332 E Quail Summit Rd
- 13348 E Quail Summit Rd
- 13356 E Quail Summit Rd
- 13320 E Quail Summit Rd
- 4305 Kimberwick Ln
- 13368 E Quail Summit Rd
- 13312 E Quail Summit Rd
- 4313 Kimberwick Ln
- 4306 Kimberwick Ln
- 13376 E Quail Summit Rd
- 4304 Fairbrook Ln
- 13304 E Quail Summit Rd
- 4314 Kimberwick Ln
- 4312 Fairbrook Ln
- 4319 Kimberwick Ln
- 13384 E Quail Summit Rd
- 13290 E Quail Summit Rd
- 4320 Kimberwick Ln
- 4318 Fairbrook Ln
- 4307 Fireside Ln
Your Personal Tour Guide
Ask me questions while you tour the home.