Estimated Value: $1,075,000 - $1,128,472
About This Home
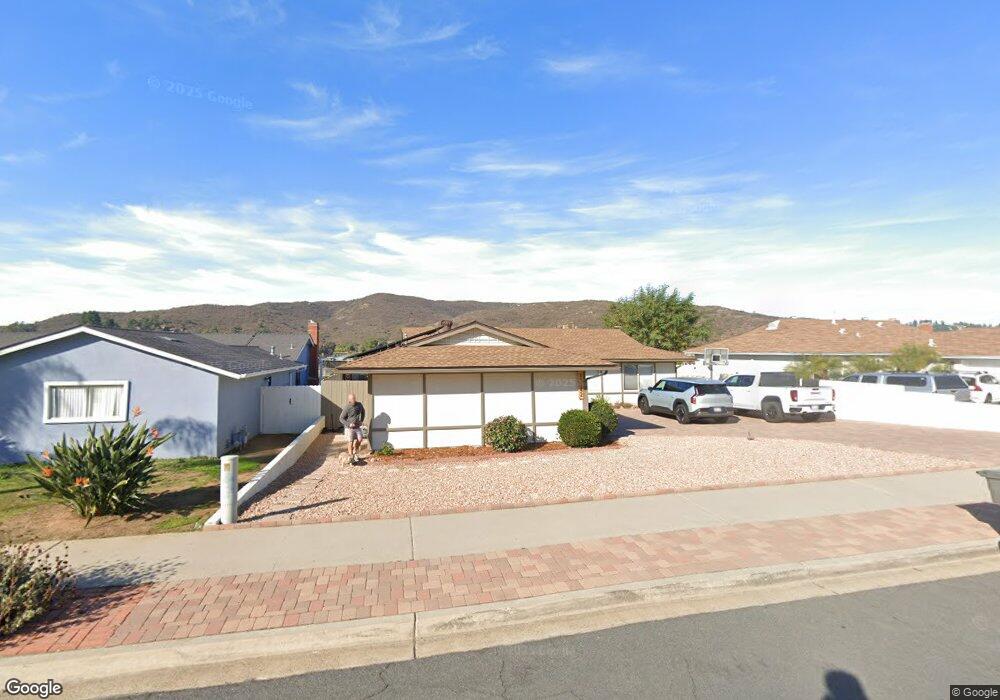
This home is located at 13342 Tobiasson Rd, Poway, CA 92064 and is currently estimated at $1,112,368, approximately $690 per square foot. 13342 Tobiasson Rd is a home located in San Diego County with nearby schools including Pomerado Elementary, Meadowbrook Middle, and Poway High.
Ownership History
We collect this data history from publicly available records. To have your information removed, we recommend requesting removal directly through your county’s website.
Purchase Details
Purchase Details
Home Financials for this Owner
Home Financials are based on the most recent Mortgage that was taken out on this home.Purchase Details
Purchase Details
Home Values in the Area
Average Home Value in this Area
Purchase History
We collect this data history from publicly available records. To have your information removed, we recommend requesting removal directly through your county’s website.
| Date | Buyer | Sale Price | Title Company |
|---|---|---|---|
| -- | None Listed On Document | ||
| -- | None Listed On Document | ||
| $650,000 | Lawyers Title Company | ||
| -- | None Available | ||
| -- | -- | ||
| -- | -- |
Mortgage History
We collect this data history from publicly available records. To have your information removed, we recommend requesting removal directly through your county’s website.
| Date | Status | Borrower | Loan Amount |
|---|---|---|---|
| Previous Owner | $617,500 |
Tax History
We collect this data history from publicly available records. To have your information removed, we recommend requesting removal directly through your county’s website.
| Year | Tax Paid | Tax Assessment Tax Assessment Total Assessment is a certain percentage of the fair market value that is determined by local assessors to be the total taxable value of land and additions on the property. | Land | Improvement |
|---|---|---|---|---|
| 2025 | $8,148 | $739,583 | $165,407 | $574,176 |
| 2024 | $8,148 | $725,082 | $162,164 | $562,918 |
| 2023 | $7,975 | $710,866 | $158,985 | $551,881 |
| 2022 | $7,842 | $696,928 | $155,868 | $541,060 |
| 2021 | $7,739 | $683,263 | $152,812 | $530,451 |
| 2020 | $7,635 | $676,258 | $151,246 | $525,012 |
| 2019 | $7,436 | $662,999 | $148,281 | $514,718 |
| 2018 | $1,037 | $91,575 | $20,481 | $71,094 |
| 2017 | $1,009 | $89,780 | $20,080 | $69,700 |
| 2016 | $987 | $88,021 | $19,687 | $68,334 |
| 2015 | $973 | $86,700 | $19,392 | $67,308 |
| 2014 | $951 | $85,003 | $19,013 | $65,990 |
Map
- 13254 Powers Ct
- 12609 Robison Blvd Unit 106
- 13148 Ridgedale Dr
- 12745 Robison Blvd Unit 18
- 13757 Eisenhower Ave
- 12717 Harmon Rd
- 13824 Powers Rd
- 12862 Carriage Heights Way
- 12875 Carriage Heights Way Unit 12875
- 12696 Harmon Rd
- 12934 Slack St
- 12953 Carriage Rd
- 12957 Ilene St
- 12838 Montauk St
- 13515 Essence Rd
- 13085 Olympus Cir Unit 1
- 13050 Tuscarora Dr
- 13068 Olympus Cir Unit 1
- 1/2 Poway Rd
- 13056 Poway Rd
- 13336 Tobiasson Rd
- 13330 Tobiasson Rd
- 13324 Tobiasson Rd
- 13404 Tobiasson Rd
- 13335 Frame Rd
- 13341 Frame Rd
- 13329 Frame Rd
- 13409 Frame Rd
- 13410 Tobiasson Rd
- 13337 Tobiasson Rd
- 13318 Tobiasson Rd
- 13331 Tobiasson Rd
- 13343 Tobiasson Rd
- 13325 Tobiasson Rd
- 13415 Frame Rd
- 13405 Tobiasson Rd
- 13317 Frame Rd
- 13319 Tobiasson Rd
- 13312 Tobiasson Rd
- 13411 Tobiasson Rd
Ask me questions while you tour the home.