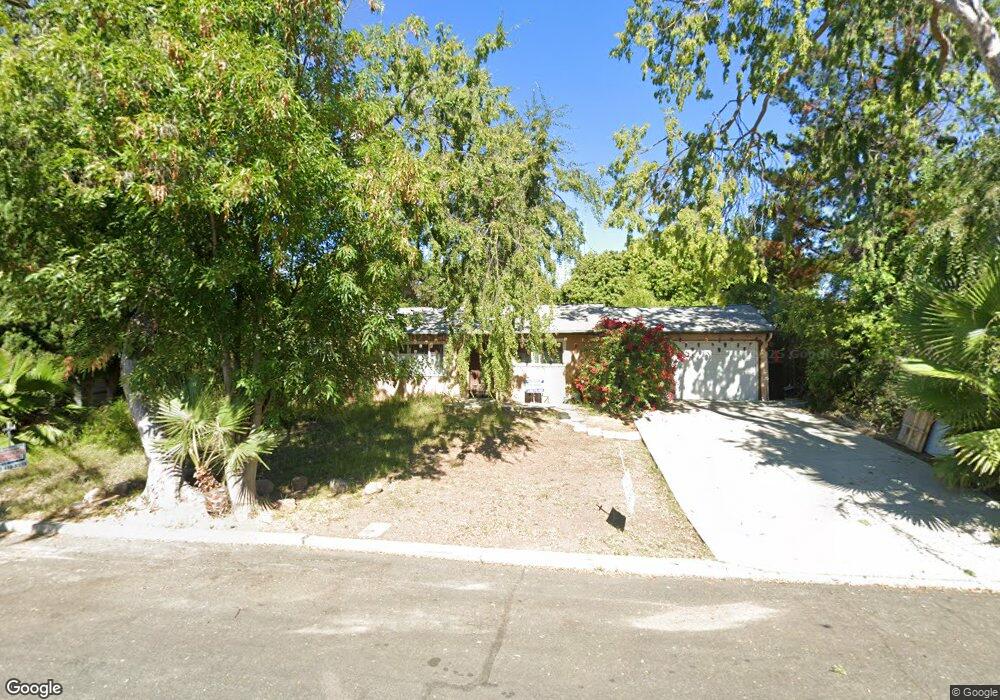
1335 Calle Crisantemo Thousand Oaks, CA 91360
Estimated Value: $743,000 - $814,000
3
Beds
1
Bath
938
Sq Ft
$824/Sq Ft
Est. Value
About This Home
This home is located at 1335 Calle Crisantemo, Thousand Oaks, CA 91360 and is currently estimated at $773,137, approximately $824 per square foot. 1335 Calle Crisantemo is a home located in Ventura County with nearby schools including Glenwood Elementary School, Los Cerritos Middle School, and Thousand Oaks High School.
Ownership History
Date
Name
Owned For
Owner Type
Purchase Details
Closed on
Apr 1, 2003
Sold by
Soloman William
Bought by
Gonzalez Patricio and Gonzalez Rocelia
Current Estimated Value
Home Financials for this Owner
Home Financials are based on the most recent Mortgage that was taken out on this home.
Original Mortgage
$319,500
Interest Rate
7.99%
Mortgage Type
Purchase Money Mortgage
Purchase Details
Closed on
Aug 3, 2000
Sold by
Gradle Maraleen R
Bought by
Solomon William
Home Financials for this Owner
Home Financials are based on the most recent Mortgage that was taken out on this home.
Original Mortgage
$147,500
Interest Rate
8.15%
Purchase Details
Closed on
Nov 14, 1994
Sold by
Gradle Maraleen R
Bought by
Gradle Maraleen R
Home Financials for this Owner
Home Financials are based on the most recent Mortgage that was taken out on this home.
Original Mortgage
$120,000
Interest Rate
8.92%
Create a Home Valuation Report for This Property
The Home Valuation Report is an in-depth analysis detailing your home's value as well as a comparison with similar homes in the area
Home Values in the Area
Average Home Value in this Area
Purchase History
| Date | Buyer | Sale Price | Title Company |
|---|---|---|---|
| Gonzalez Patricio | $355,000 | First Southwestern Title Co | |
| Solomon William | $207,500 | Chicago Title Insurance Co | |
| Gradle Maraleen R | -- | Fidelity National Title Co |
Source: Public Records
Mortgage History
| Date | Status | Borrower | Loan Amount |
|---|---|---|---|
| Previous Owner | Gonzalez Patricio | $319,500 | |
| Previous Owner | Solomon William | $147,500 | |
| Previous Owner | Gradle Maraleen R | $120,000 | |
| Closed | Gonzalez Patricio | $10,000 |
Source: Public Records
Tax History Compared to Growth
Tax History
| Year | Tax Paid | Tax Assessment Tax Assessment Total Assessment is a certain percentage of the fair market value that is determined by local assessors to be the total taxable value of land and additions on the property. | Land | Improvement |
|---|---|---|---|---|
| 2025 | $7,861 | $514,136 | $257,070 | $257,066 |
| 2024 | $7,861 | $504,055 | $252,029 | $252,026 |
| 2023 | $7,685 | $494,172 | $247,087 | $247,085 |
| 2022 | $7,586 | $484,483 | $242,242 | $242,241 |
| 2021 | $7,492 | $474,984 | $237,492 | $237,492 |
| 2020 | $7,027 | $470,114 | $235,057 | $235,057 |
| 2019 | $6,892 | $460,898 | $230,449 | $230,449 |
| 2018 | $6,790 | $451,862 | $225,931 | $225,931 |
| 2017 | $6,678 | $443,002 | $221,501 | $221,501 |
| 2016 | $4,582 | $434,316 | $217,158 | $217,158 |
| 2015 | $4,501 | $427,794 | $213,897 | $213,897 |
| 2014 | $4,126 | $390,000 | $196,000 | $194,000 |
Source: Public Records
Map
Nearby Homes
- 1356 Calle Crisantemo
- 1373 Calle Crisantemo
- 1455 Calle Tulipan
- 1233 Calle Pensamiento
- 1322 E Avenida de Los Arboles
- 1449 Calle Durazno
- 970 Calle Nogal
- 960 Calle Margarita
- 1652 Orinda Ct
- 1764 Shady Brook Dr
- 823 Calle Margarita
- 914 Calle Jazmin
- 1541 Eucalyptus Cir
- 2965 Dogwood Cir
- 2961 Ponderosa Cir
- 1634 Fremont Dr
- 1778 E Avenida de Las Flores Unit 85
- 2847 Cedar Wood Place
- 1534 Holly Ct
- 1540 Holly Ct
- 1341 Calle Crisantemo
- 1329 Calle Crisantemo
- 1348 Calle Bouganvilla
- 1342 Calle Bouganvilla
- 1354 Calle Bouganvilla
- 1349 Calle Crisantemo
- 1323 Calle Crisantemo
- 1338 Calle Crisantemo
- 1332 Calle Crisantemo
- 1336 Calle Bouganvilla
- 1360 Calle Bouganvilla
- 1344 Calle Crisantemo
- 1326 Calle Crisantemo
- 1355 Calle Crisantemo
- 1317 Calle Crisantemo
- 1330 Calle Bouganvilla
- 1350 Calle Crisantemo
- 1366 Calle Bouganvilla
- 1316 Calle Crisantemo
- 1375 Calle Tulipan