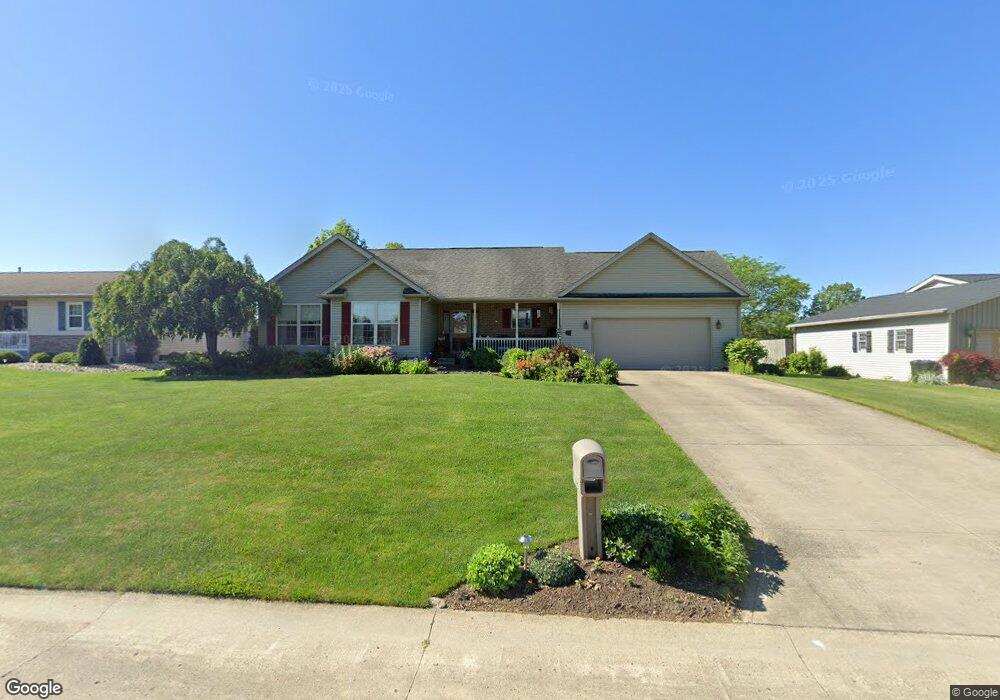
1335 Grandview Ave Bucyrus, OH 44820
Estimated Value: $208,000 - $248,000
3
Beds
2
Baths
1,365
Sq Ft
$172/Sq Ft
Est. Value
About This Home
This home is located at 1335 Grandview Ave, Bucyrus, OH 44820 and is currently estimated at $235,192, approximately $172 per square foot. 1335 Grandview Ave is a home located in Crawford County with nearby schools including Hannah Crawford Elementary School (PK-2), Hannah Crawford Elementary School (3 - 5), and William Crawford Intermediate School.
Ownership History
Date
Name
Owned For
Owner Type
Purchase Details
Closed on
Jul 3, 2015
Sold by
Shupp Kenneth A and Shupp Cheryl L
Bought by
Shupp Kenneth A and Shupp Cheryl L
Current Estimated Value
Purchase Details
Closed on
Jan 27, 2009
Sold by
Shupp Kenneth A
Bought by
Shupp Chery L
Home Financials for this Owner
Home Financials are based on the most recent Mortgage that was taken out on this home.
Original Mortgage
$108,000
Interest Rate
5.03%
Mortgage Type
New Conventional
Purchase Details
Closed on
Jun 29, 2007
Sold by
Gerhart Charles E and Gerhart Rebecca L
Bought by
Shupp Kenneth A
Home Financials for this Owner
Home Financials are based on the most recent Mortgage that was taken out on this home.
Original Mortgage
$110,000
Interest Rate
6.26%
Mortgage Type
New Conventional
Purchase Details
Closed on
Feb 9, 2002
Bought by
Shupp Kenneth A and Shupp Cheryl
Create a Home Valuation Report for This Property
The Home Valuation Report is an in-depth analysis detailing your home's value as well as a comparison with similar homes in the area
Home Values in the Area
Average Home Value in this Area
Purchase History
| Date | Buyer | Sale Price | Title Company |
|---|---|---|---|
| Shupp Kenneth A | -- | Attorney | |
| Shupp Chery L | -- | -- | |
| Shupp Kenneth A | $180,000 | -- | |
| Shupp Kenneth A | -- | -- |
Source: Public Records
Mortgage History
| Date | Status | Borrower | Loan Amount |
|---|---|---|---|
| Closed | Shupp Chery L | $108,000 | |
| Closed | Shupp Kenneth A | $110,000 |
Source: Public Records
Tax History Compared to Growth
Tax History
| Year | Tax Paid | Tax Assessment Tax Assessment Total Assessment is a certain percentage of the fair market value that is determined by local assessors to be the total taxable value of land and additions on the property. | Land | Improvement |
|---|---|---|---|---|
| 2024 | $2,451 | $73,790 | $6,050 | $67,740 |
| 2023 | $2,451 | $53,120 | $5,130 | $47,990 |
| 2022 | $2,091 | $53,120 | $5,130 | $47,990 |
| 2021 | $2,162 | $53,120 | $5,130 | $47,990 |
| 2020 | $1,894 | $46,860 | $5,130 | $41,730 |
| 2019 | $1,966 | $46,860 | $5,130 | $41,730 |
| 2018 | $1,966 | $46,860 | $5,130 | $41,730 |
| 2017 | $1,823 | $44,600 | $5,130 | $39,470 |
| 2016 | $1,754 | $44,600 | $5,130 | $39,470 |
| 2015 | $1,714 | $44,600 | $5,130 | $39,470 |
| 2014 | $1,787 | $44,600 | $5,130 | $39,470 |
| 2013 | $1,747 | $44,600 | $5,130 | $39,470 |
Source: Public Records
Map
Nearby Homes
- 1465 Oakridge Dr
- 1267 N Dundee Trail
- 111 Kincora Dr
- 1320 E Southern Ave
- 948 S Highland Ave
- 318 Charlotte St
- 419 Short St
- 2208 State Route 19
- 1211 S Sandusky Ave
- 346 Hopley Ave
- 1021 S Sandusky Ave
- 1220 E Warren St
- 583 Rogers St
- 924 E Warren St
- 444 Woodlawn Ave
- 708 S Sandusky Ave
- 900 S Spring St
- 550 S Walnut St
- 412 E Rensselaer St
- 452 Pleasant Ln
- 1373 Grandview Ave
- 1325 Grandview Ave
- 1350 Oakridge Dr
- 1370 Oakridge Dr
- 1330 Oakridge Dr
- 1393 Grandview Ave
- 1350 Grandview Dr
- 1323 Grandview Dr
- 1323 Grandview Ave
- 1350 Grandview Ave
- 1330 Grandview Ave
- 1370 Grandview Ave
- 1390 Oakridge Dr
- 1320 Oakridge Dr
- 1420 Grandview Ave
- 1320 Grandview Ave
- 1540 Grandview Ave
- 1353 Oakridge Dr
- 1373 Oakridge Dr
- 1333 Oakridge Dr