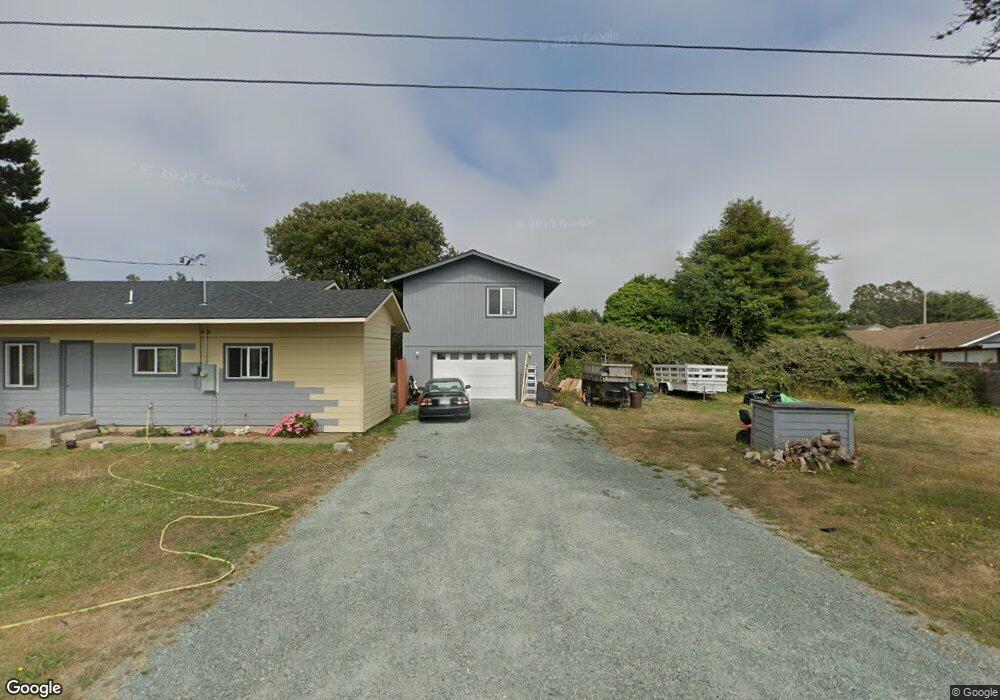
1335 Jordan St Unit 39 Crescent City, CA 95531
Estimated Value: $173,000 - $285,000
2
Beds
1
Bath
800
Sq Ft
$269/Sq Ft
Est. Value
About This Home
This home is located at 1335 Jordan St Unit 39, Crescent City, CA 95531 and is currently estimated at $215,345, approximately $269 per square foot. 1335 Jordan St Unit 39 is a home located in Del Norte County with nearby schools including Bess Maxwell Elementary School, Crescent Elk Middle School, and Del Norte High School.
Ownership History
Date
Name
Owned For
Owner Type
Purchase Details
Closed on
Jul 14, 2016
Sold by
Decamara Alfred and De Camara Sherri
Bought by
Costello Eric J
Current Estimated Value
Purchase Details
Closed on
Feb 3, 2016
Sold by
Akeroyd Dawn Abernathy and Costello Dawn M
Bought by
Costello Eric J
Purchase Details
Closed on
Jul 1, 2009
Sold by
Costello Eric J and Costello Dawn M
Bought by
Costello Eric J and Costello Dawn M
Purchase Details
Closed on
Aug 11, 2003
Sold by
Syrstad Lowell and Syrstad Carol K M
Bought by
Costello Eric J and Costello Dawn M
Home Financials for this Owner
Home Financials are based on the most recent Mortgage that was taken out on this home.
Original Mortgage
$60,100
Interest Rate
5.46%
Mortgage Type
Purchase Money Mortgage
Create a Home Valuation Report for This Property
The Home Valuation Report is an in-depth analysis detailing your home's value as well as a comparison with similar homes in the area
Home Values in the Area
Average Home Value in this Area
Purchase History
| Date | Buyer | Sale Price | Title Company |
|---|---|---|---|
| Costello Eric J | -- | None Available | |
| Costello Eric J | -- | None Available | |
| Costello Eric J | $55,000 | None Available | |
| Costello Eric J | $78,000 | Crescent Land Title |
Source: Public Records
Mortgage History
| Date | Status | Borrower | Loan Amount |
|---|---|---|---|
| Previous Owner | Costello Eric J | $60,100 | |
| Closed | Costello Eric J | $10,000 |
Source: Public Records
Tax History Compared to Growth
Tax History
| Year | Tax Paid | Tax Assessment Tax Assessment Total Assessment is a certain percentage of the fair market value that is determined by local assessors to be the total taxable value of land and additions on the property. | Land | Improvement |
|---|---|---|---|---|
| 2025 | $2,493 | $137,235 | $62,703 | $74,532 |
| 2024 | $2,493 | $134,545 | $61,474 | $73,071 |
| 2023 | $1,899 | $131,908 | $60,269 | $71,639 |
| 2022 | $1,852 | $129,323 | $59,088 | $70,235 |
| 2021 | $1,136 | $91,463 | $57,930 | $33,533 |
| 2020 | $1,499 | $90,526 | $57,336 | $33,190 |
| 2019 | $1,057 | $88,752 | $56,212 | $32,540 |
| 2018 | $1,038 | $87,012 | $55,110 | $31,902 |
| 2017 | $1,813 | $85,307 | $54,030 | $31,277 |
| 2016 | $2,291 | $110,723 | $59,178 | $51,545 |
| 2015 | $2,148 | $109,061 | $58,290 | $50,771 |
| 2014 | $2,295 | $106,926 | $57,149 | $49,777 |
Source: Public Records
Map
Nearby Homes
- 650 E Washington Blvd
- 650 E Washington Blvd Unit Crescent Senior Mobi
- 1210 Douglas St
- 1329 Burtschell Place
- 0000 E Washington Blvd
- 1102 Burtschell St
- 160 Leif Cir
- 145 Mason Ct
- 525 Leif Cir
- 373 Grant Ave
- 120 W Coolidge Ave
- 125 W Washington Blvd
- 120 Tide St
- 435 Leif Cir Unit Washington
- 0 E Adams Ave
- 365 Leif Cir
- 1661 Northcrest Dr Unit Space 96
- 1718 Northcrest Dr
- 1093
- 1725 Northcrest Dr
- 1355 Jordan St
- 1319 Jordan St
- 1320 Harrold St
- 1310 Harrold St
- 1336 Harrold St
- 1301 Jordan St
- 580 E Coolidge Ave
- 1344 Harrold St
- 1379 Jordan St
- 1350 Harrold St
- 1360 Harrold St
- 1380 Jordan St
- 1305 Harrold St
- 1317 Northcrest Dr
- 555 E Coolidge Ave
- 1386 Jordan St
- 1325 Harrold St
- 1335 Harrold St
- 1329 Northcrest Dr
- 1331 Northcrest Dr