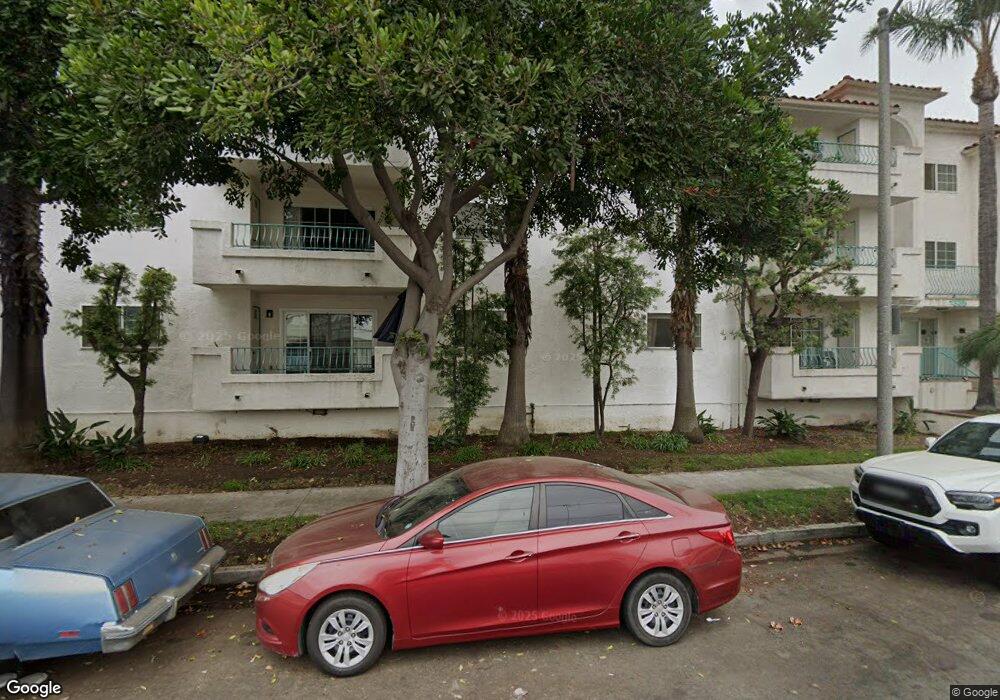
1335 Newport Ave Unit 301 Long Beach, CA 90804
Bryant NeighborhoodEstimated Value: $411,590 - $491,000
1
Bed
1
Bath
754
Sq Ft
$597/Sq Ft
Est. Value
About This Home
This home is located at 1335 Newport Ave Unit 301, Long Beach, CA 90804 and is currently estimated at $450,148, approximately $597 per square foot. 1335 Newport Ave Unit 301 is a home located in Los Angeles County with nearby schools including Bryant Elementary School, Woodrow Wilson High School, and Maple Village Waldorf School.
Ownership History
Date
Name
Owned For
Owner Type
Purchase Details
Closed on
Jun 25, 2003
Sold by
Domanchich Jerome A
Bought by
Morales Walter
Current Estimated Value
Home Financials for this Owner
Home Financials are based on the most recent Mortgage that was taken out on this home.
Original Mortgage
$152,000
Outstanding Balance
$63,678
Interest Rate
5.18%
Mortgage Type
Purchase Money Mortgage
Estimated Equity
$386,470
Purchase Details
Closed on
Nov 17, 2000
Sold by
Holbrook Nancy E
Bought by
Domanchich Jerome A
Purchase Details
Closed on
Mar 25, 1996
Sold by
Pacific Inland Bank
Bought by
Domanchich Jerome A and Domanchich Danielle
Home Financials for this Owner
Home Financials are based on the most recent Mortgage that was taken out on this home.
Original Mortgage
$58,850
Interest Rate
6.98%
Mortgage Type
FHA
Create a Home Valuation Report for This Property
The Home Valuation Report is an in-depth analysis detailing your home's value as well as a comparison with similar homes in the area
Home Values in the Area
Average Home Value in this Area
Purchase History
| Date | Buyer | Sale Price | Title Company |
|---|---|---|---|
| Morales Walter | $190,000 | Natc | |
| Domanchich Jerome A | -- | -- | |
| Domanchich Jerome A | $60,000 | Chicago Title Co |
Source: Public Records
Mortgage History
| Date | Status | Borrower | Loan Amount |
|---|---|---|---|
| Open | Morales Walter | $152,000 | |
| Previous Owner | Domanchich Jerome A | $58,850 | |
| Closed | Morales Walter | $28,500 |
Source: Public Records
Tax History Compared to Growth
Tax History
| Year | Tax Paid | Tax Assessment Tax Assessment Total Assessment is a certain percentage of the fair market value that is determined by local assessors to be the total taxable value of land and additions on the property. | Land | Improvement |
|---|---|---|---|---|
| 2025 | $3,433 | $270,119 | $171,033 | $99,086 |
| 2024 | $3,433 | $264,824 | $167,680 | $97,144 |
| 2023 | $3,372 | $259,633 | $164,393 | $95,240 |
| 2022 | $3,164 | $254,543 | $161,170 | $93,373 |
| 2021 | $3,097 | $249,553 | $158,010 | $91,543 |
| 2019 | $3,051 | $242,153 | $153,324 | $88,829 |
| 2018 | $2,975 | $237,406 | $150,318 | $87,088 |
| 2016 | $2,735 | $228,189 | $144,482 | $83,707 |
| 2015 | $2,625 | $224,762 | $142,312 | $82,450 |
| 2014 | $2,400 | $202,000 | $128,000 | $74,000 |
Source: Public Records
Map
Nearby Homes
- 1335 Newport Ave Unit 107
- 1355 Loma Ave Unit 306
- 3605 E Anaheim St Unit 315
- 1354 Euclid Ave
- 1445 Coronado Ave
- 1407 Obispo Ave
- 1100 Euclid Ave Unit 108
- 1207 Obispo Ave Unit 212
- 1207 Obispo Ave Unit 107
- 1075 Coronado Ave
- 1030 Loma Ave Unit 105
- 3401 E Wilton St
- 1353 Termino Ave
- 1070 Freeman Ave
- 932 Coronado Ave
- 920 Loma Ave
- 1073 Orizaba Ave
- 1702 Freeman Ave
- 1108 Termino Ave
- 1201 Belmont Ave Unit 303
- 1335 Newport Ave Unit 309
- 1335 Newport Ave Unit 308
- 1335 Newport Ave Unit 307
- 1335 Newport Ave Unit 306
- 1335 Newport Ave Unit 106
- 1335 Newport Ave Unit 105
- 1335 Newport Ave Unit 104
- 1335 Newport Ave Unit 103
- 1335 Newport Ave Unit 102
- 1335 Newport Ave Unit 101
- 1335 Newport Ave Unit 305
- 1335 Newport Ave Unit 304
- 1335 Newport Ave Unit 303
- 1335 Newport Ave Unit 302
- 1335 Newport Ave Unit 209
- 1335 Newport Ave Unit 208
- 1335 Newport Ave Unit 207
- 1335 Newport Ave Unit 206
- 1335 Newport Ave Unit 205
- 1335 Newport Ave Unit 204