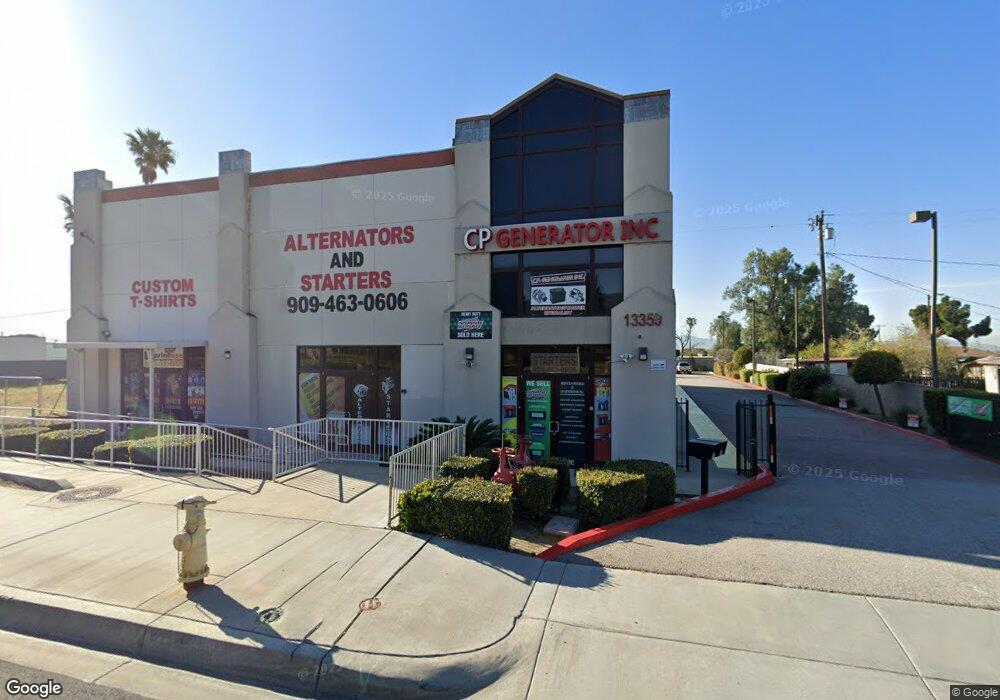
13359 Foothill Blvd Fontana, CA 92335
Estimated Value: $2,976,544
1
Bed
1
Bath
7,914
Sq Ft
$376/Sq Ft
Est. Value
About This Home
This home is located at 13359 Foothill Blvd, Fontana, CA 92335 and is currently estimated at $2,976,544, approximately $376 per square foot. 13359 Foothill Blvd is a home located in San Bernardino County with nearby schools including Almond Elementary School, Sequoia Middle School, and Summit High School.
Ownership History
Date
Name
Owned For
Owner Type
Purchase Details
Closed on
Jul 9, 2015
Sold by
Almaz Ladan
Bought by
Almaz Sam
Current Estimated Value
Purchase Details
Closed on
Apr 22, 2015
Sold by
Almaz Sam
Bought by
Perez Family Trust
Purchase Details
Closed on
Jul 17, 2009
Sold by
Eskaf Elya
Bought by
Almaz Sam
Purchase Details
Closed on
Dec 12, 2005
Sold by
Eskaf Elya
Bought by
City Of Fontana
Purchase Details
Closed on
May 11, 2005
Sold by
James Kathryn Jean
Bought by
Eskaf Elya and Eskaf Hala
Home Financials for this Owner
Home Financials are based on the most recent Mortgage that was taken out on this home.
Original Mortgage
$125,000
Interest Rate
5.87%
Mortgage Type
Commercial
Purchase Details
Closed on
Apr 1, 1999
Sold by
Magda Almaz Antoine
Bought by
Almaz Sam
Create a Home Valuation Report for This Property
The Home Valuation Report is an in-depth analysis detailing your home's value as well as a comparison with similar homes in the area
Home Values in the Area
Average Home Value in this Area
Purchase History
| Date | Buyer | Sale Price | Title Company |
|---|---|---|---|
| Almaz Sam | -- | Corinthian Title Company | |
| Perez Family Trust | $1,408,500 | Corinthian Title Company | |
| Almaz Sam | $684,084 | Accommodation | |
| City Of Fontana | -- | -- | |
| Eskaf Elya | $625,000 | -- | |
| Almaz Sam | -- | -- |
Source: Public Records
Mortgage History
| Date | Status | Borrower | Loan Amount |
|---|---|---|---|
| Previous Owner | Eskaf Elya | $125,000 |
Source: Public Records
Tax History Compared to Growth
Tax History
| Year | Tax Paid | Tax Assessment Tax Assessment Total Assessment is a certain percentage of the fair market value that is determined by local assessors to be the total taxable value of land and additions on the property. | Land | Improvement |
|---|---|---|---|---|
| 2025 | $17,275 | $1,667,379 | $461,149 | $1,206,230 |
| 2024 | $17,275 | $1,634,685 | $452,107 | $1,182,578 |
| 2023 | $16,828 | $1,602,632 | $443,242 | $1,159,390 |
| 2022 | $16,761 | $1,571,208 | $434,551 | $1,136,657 |
| 2021 | $16,549 | $1,540,400 | $426,030 | $1,114,370 |
| 2020 | $16,510 | $1,524,606 | $421,662 | $1,102,944 |
| 2019 | $16,005 | $1,494,712 | $413,394 | $1,081,318 |
| 2018 | $16,252 | $1,465,404 | $405,288 | $1,060,116 |
| 2017 | $16,160 | $1,436,670 | $397,341 | $1,039,329 |
| 2016 | $11,825 | $1,047,886 | $455,138 | $592,748 |
| 2015 | $11,674 | $1,032,145 | $448,301 | $583,844 |
| 2014 | $11,683 | $1,011,926 | $439,519 | $572,407 |
Source: Public Records
Map
Nearby Homes
- 8221 Ilex St Unit 23
- 8221 Ilex St Unit 10
- 8051 Mcgregor Ct
- 13296 Joliet Dr
- 8090 Cornwall Ct Unit 13
- 8283 Cornwall Ave
- 13681 Lexus Ln
- 13422 Banning St
- 7881 Margaux Place
- 13841 Cobblestone Ct
- 13868 Lexus Ln
- 7638 Tuscany Place
- 13152 River Oaks Dr
- 13414 Columbus Ct
- 13643 Cabrillo Ct
- 8043 Tuscany St
- 7685 Hitching Post Ct
- 14093 Marbella St
- 7543 W Liberty Pkwy Unit 711
- 14028 Yorktown Ct
- 13351 Foothill Blvd
- 13381 Foothill Blvd
- 8131 Ilex St
- 8139 Ilex St
- 13366 Chestnut St
- 8179 Ilex St
- 221 Ilex St
- 8055 Jamestown Cir
- 8057 Jamestown Cir
- 8053 Jamestown Cir
- 8051 Jamestown Cir
- 13380 Chestnut St
- 13370 Chestnut St
- 8049 Jamestown Cir
- 13360 Chestnut St
- 13390 Chestnut St
- 8047 Jamestown Cir
- 8045 Jamestown Cir
- 8059 Jamestown Cir
- 8060 Jamestown Cir