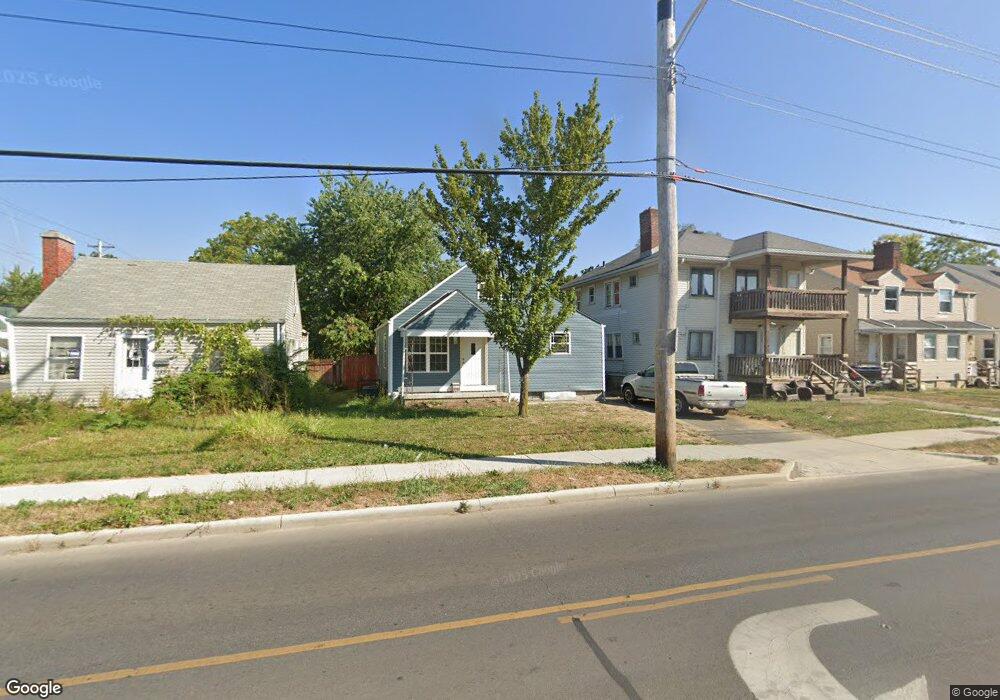
1336 E Hudson St Columbus, OH 43211
North Linden NeighborhoodEstimated Value: $109,000 - $154,537
3
Beds
1
Bath
1,043
Sq Ft
$124/Sq Ft
Est. Value
About This Home
This home is located at 1336 E Hudson St, Columbus, OH 43211 and is currently estimated at $128,884, approximately $123 per square foot. 1336 E Hudson St is a home located in Franklin County with nearby schools including Linden-Mckinley Stem School On Arcadia, North Columbus Preparatory Academy, and Midnimo Cross Cultural Middle School.
Ownership History
Date
Name
Owned For
Owner Type
Purchase Details
Closed on
Sep 1, 2023
Sold by
Baker Barry D
Bought by
Morin Marco A
Current Estimated Value
Purchase Details
Closed on
Apr 28, 2006
Sold by
Storts Stephen M and Storts Pamela A
Bought by
Sharp Brian L
Home Financials for this Owner
Home Financials are based on the most recent Mortgage that was taken out on this home.
Original Mortgage
$58,000
Interest Rate
6.39%
Mortgage Type
Fannie Mae Freddie Mac
Purchase Details
Closed on
Jan 18, 2006
Sold by
Storts Pamela A
Bought by
Storts Stephen M
Purchase Details
Closed on
Dec 20, 2005
Sold by
Taris Edward L and Joseph E Taris Living Trust
Bought by
Storts Pamela A
Purchase Details
Closed on
Sep 18, 2002
Sold by
Gamma Holding & Trading Company
Bought by
Taris Joseph E and The Joseph E Taris Living Trus
Purchase Details
Closed on
Mar 25, 1987
Bought by
Gamma Holding & Trading
Purchase Details
Closed on
Jan 1, 1987
Purchase Details
Closed on
Jul 1, 1986
Create a Home Valuation Report for This Property
The Home Valuation Report is an in-depth analysis detailing your home's value as well as a comparison with similar homes in the area
Home Values in the Area
Average Home Value in this Area
Purchase History
| Date | Buyer | Sale Price | Title Company |
|---|---|---|---|
| Morin Marco A | $57,200 | Allodial Title | |
| Sharp Brian L | $58,000 | None Available | |
| Storts Stephen M | -- | Independent | |
| Storts Pamela A | -- | Principle T | |
| Taris Joseph E | -- | -- | |
| Gamma Holding & Trading | -- | -- | |
| -- | $28,000 | -- | |
| -- | $30,000 | -- |
Source: Public Records
Mortgage History
| Date | Status | Borrower | Loan Amount |
|---|---|---|---|
| Previous Owner | Sharp Brian L | $58,000 |
Source: Public Records
Tax History
| Year | Tax Paid | Tax Assessment Tax Assessment Total Assessment is a certain percentage of the fair market value that is determined by local assessors to be the total taxable value of land and additions on the property. | Land | Improvement |
|---|---|---|---|---|
| 2025 | $3,099 | $45,300 | $10,470 | $34,830 |
| 2024 | $3,099 | $45,300 | $10,470 | $34,830 |
| 2023 | $3,836 | $45,300 | $10,470 | $34,830 |
| 2022 | $2,234 | $20,730 | $5,080 | $15,650 |
| 2021 | $1,077 | $20,730 | $5,080 | $15,650 |
| 2020 | $1,120 | $20,730 | $5,080 | $15,650 |
| 2019 | $1,032 | $17,010 | $4,410 | $12,600 |
| 2018 | $973 | $17,010 | $4,410 | $12,600 |
| 2017 | $1,020 | $17,010 | $4,410 | $12,600 |
| 2016 | $1,009 | $15,230 | $3,120 | $12,110 |
| 2015 | $916 | $15,230 | $3,120 | $12,110 |
| 2014 | $918 | $15,230 | $3,120 | $12,110 |
| 2013 | $533 | $17,920 | $3,675 | $14,245 |
Source: Public Records
Map
Nearby Homes
- 1332 E Hudson St
- 1279 Loretta Ave
- 1257 Loretta Ave
- 2316 Ontario St
- 2260 Homestead Dr
- 1362 Clinton St
- 1430 Kenmore Rd
- 2204 Medina Ave
- 1475 E Hudson St
- 2309 Gerbert Rd
- 2195 Dresden St
- 1450 Briarwood Ave
- 2332 Hamilton Ave
- 2320 Hamilton Ave
- 1481 Kohr Place
- 2209 Ontario St
- 1143 Loretta Ave
- 1497 Myrtle Ave
- 2154 Dresden St
- 1436 Arlington Ave
- 1340 E Hudson St Unit 342
- 1342 E Hudson St
- 1346 E Hudson St Unit 348
- 1352 E Hudson St Unit 354
- 1429 Medina Ave
- 1343 Loretta Ave
- 1320 E Hudson St
- 1349 Loretta Ave
- 1337 Loretta Ave
- 1358 E Hudson St
- 1353 Loretta Ave
- 695 E Hudson St
- 1337 E Hudson St
- 1359 Loretta Ave
- 1329 E Hudson St
- 1341 E Hudson St
- 1325 Loretta Ave
- 1364 E Hudson St
- 1345 E Hudson St
- 1310 E Hudson St
Your Personal Tour Guide
Ask me questions while you tour the home.