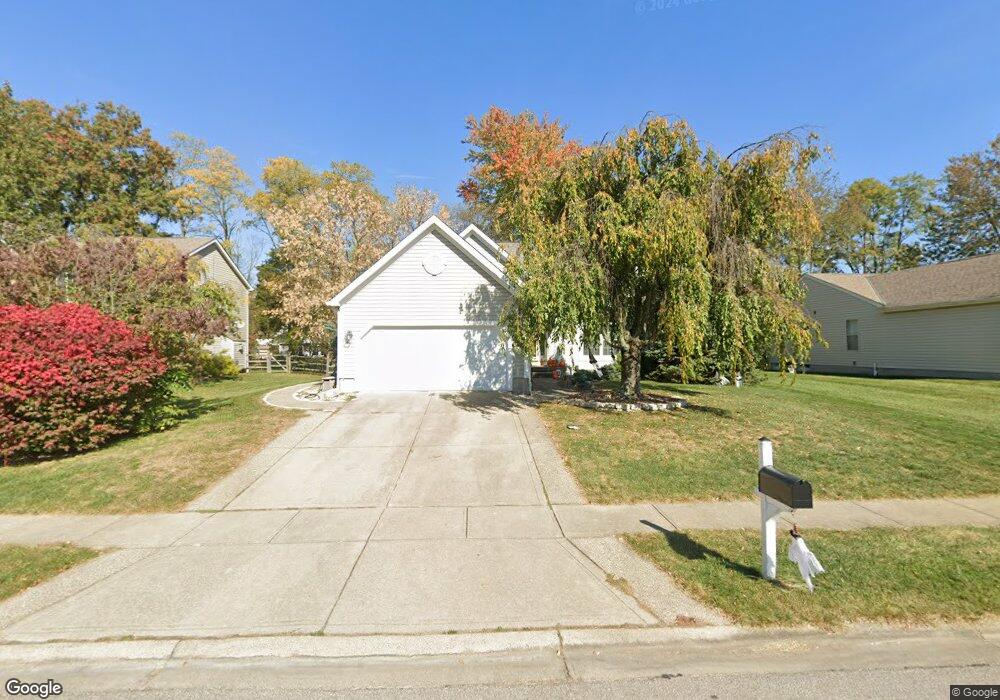
1336 Inlet Ct Amelia, OH 45102
Estimated Value: $321,508 - $356,000
3
Beds
3
Baths
1,502
Sq Ft
$225/Sq Ft
Est. Value
About This Home
This home is located at 1336 Inlet Ct, Amelia, OH 45102 and is currently estimated at $337,877, approximately $224 per square foot. 1336 Inlet Ct is a home located in Clermont County with nearby schools including Merwin Elementary School, West Clermont Middle School, and West Clermont High School.
Ownership History
Date
Name
Owned For
Owner Type
Purchase Details
Closed on
Aug 15, 2006
Sold by
Davis Donald S and Stewart Susan L
Bought by
Labeda Bartosz A and Kerscher Mollie J
Current Estimated Value
Home Financials for this Owner
Home Financials are based on the most recent Mortgage that was taken out on this home.
Original Mortgage
$39,600
Interest Rate
6.53%
Mortgage Type
Stand Alone Second
Purchase Details
Closed on
Jul 1, 1996
Sold by
M/I Schottenstein Homes
Bought by
Davis Donald S and Stewart Susan L
Home Financials for this Owner
Home Financials are based on the most recent Mortgage that was taken out on this home.
Original Mortgage
$137,250
Interest Rate
8.13%
Mortgage Type
Balloon
Purchase Details
Closed on
Mar 25, 1996
Sold by
Robert C Rhein Interests
Bought by
M/I Schottenstein Homes Inc
Create a Home Valuation Report for This Property
The Home Valuation Report is an in-depth analysis detailing your home's value as well as a comparison with similar homes in the area
Home Values in the Area
Average Home Value in this Area
Purchase History
| Date | Buyer | Sale Price | Title Company |
|---|---|---|---|
| Labeda Bartosz A | $198,000 | None Available | |
| Davis Donald S | $144,523 | -- | |
| M/I Schottenstein Homes Inc | $26,775 | -- |
Source: Public Records
Mortgage History
| Date | Status | Borrower | Loan Amount |
|---|---|---|---|
| Closed | Labeda Bartosz A | $39,600 | |
| Open | Labeda Bartosz A | $158,400 | |
| Previous Owner | Davis Donald S | $137,250 |
Source: Public Records
Tax History
| Year | Tax Paid | Tax Assessment Tax Assessment Total Assessment is a certain percentage of the fair market value that is determined by local assessors to be the total taxable value of land and additions on the property. | Land | Improvement |
|---|---|---|---|---|
| 2024 | $4,346 | $93,170 | $18,620 | $74,550 |
| 2023 | $4,358 | $93,170 | $18,620 | $74,550 |
| 2022 | $3,518 | $66,570 | $13,300 | $53,270 |
| 2021 | $3,538 | $66,570 | $13,300 | $53,270 |
| 2020 | $3,545 | $66,570 | $13,300 | $53,270 |
| 2019 | $2,657 | $55,240 | $12,990 | $42,250 |
| 2018 | $2,686 | $55,240 | $12,990 | $42,250 |
| 2017 | $2,787 | $55,240 | $12,990 | $42,250 |
| 2016 | $2,787 | $52,120 | $12,250 | $39,870 |
| 2015 | $2,649 | $52,120 | $12,250 | $39,870 |
| 2014 | $2,649 | $52,120 | $12,250 | $39,870 |
| 2013 | $2,575 | $49,910 | $11,900 | $38,010 |
Source: Public Records
Map
Nearby Homes
- 1342 Covedale Ln
- 1335 Lakefront Ct
- 3692 Shag Bark
- 1328 Hammann Dr
- 4 Gumbert Dr
- 3826 Golden Meadow Ct
- 3733 Maplebrooke Ln
- 3735 Maplebrooke Ln
- 3821 Golden Meadow Ct
- 3664 Lewis Rd
- 3815 Lilac Ln
- 1204 Buxton Oaks Dr
- 1205 Buxton Oaks Dr
- 3726 Oakwood Dr
- 1190 Twin Gate Run
- 57 Marigold Ln
- 360 Amelia Olive Branch Rd
- 85 Glen Mary Dr
- 81 Glen Mary Dr
- 3630 N Heartwood Rd
- 1338 Inlet Ct
- 1334 Inlet Ct
- 1337 Covedale Ln
- 1339 Covedale Ln
- 1335 Covedale Ln
- 3687 Bristol Lake Dr
- 3689 Bristol Lake Dr
- 1337 Inlet Ct
- 1339 Inlet Ct
- 1333 Covedale Ln
- 1335 Inlet Ct
- 1330 Inlet Ct
- 3683 Bristol Lake Dr
- 1341 Covedale Ln
- 1331 Covedale Ln
- 1329 Covedale Ln
- 3681 Bristol Lake Dr
- 1327 Covedale Ln
- 1334 Lakefront Ct
- 1333 Inlet Ct
Your Personal Tour Guide
Ask me questions while you tour the home.