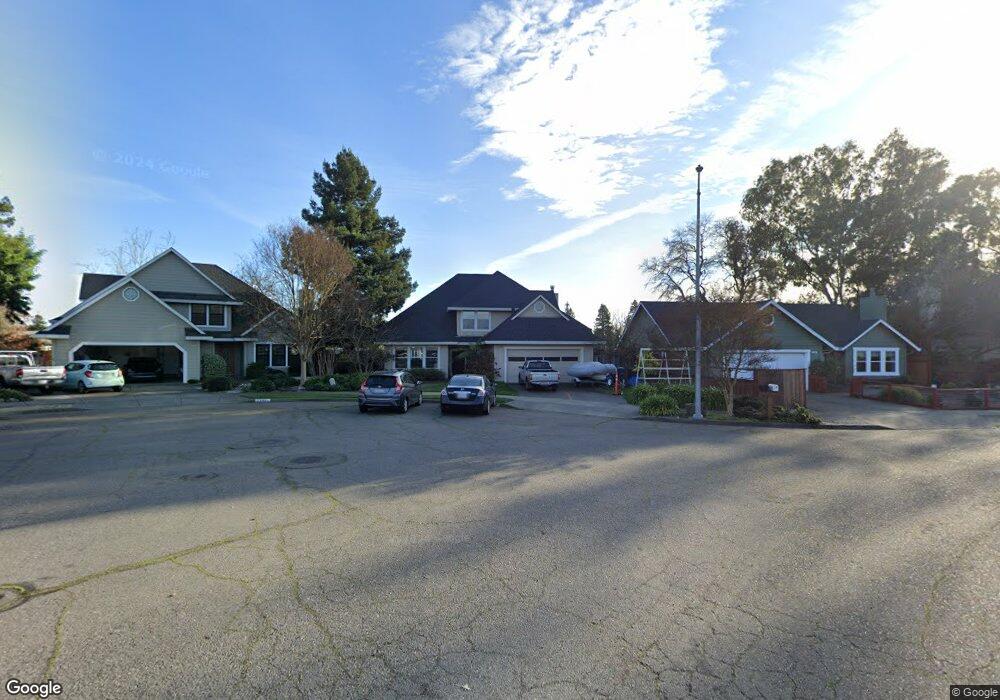
1336 Jennings Park Way Santa Rosa, CA 95401
Northwest Santa Rosa NeighborhoodEstimated Value: $679,000 - $873,000
3
Beds
3
Baths
2,203
Sq Ft
$341/Sq Ft
Est. Value
About This Home
This home is located at 1336 Jennings Park Way, Santa Rosa, CA 95401 and is currently estimated at $750,166, approximately $340 per square foot. 1336 Jennings Park Way is a home located in Sonoma County with nearby schools including Helen M. Lehman Elementary School, Hilliard Comstock Middle School, and Santa Rosa High School.
Ownership History
Date
Name
Owned For
Owner Type
Purchase Details
Closed on
Oct 13, 1997
Sold by
Feibusch Marianne C
Bought by
Feibusch Marianne C and The Marianne C Feibusch Revoca
Current Estimated Value
Home Financials for this Owner
Home Financials are based on the most recent Mortgage that was taken out on this home.
Original Mortgage
$112,000
Outstanding Balance
$18,136
Interest Rate
7.54%
Estimated Equity
$732,030
Purchase Details
Closed on
Oct 2, 1997
Sold by
Hutton W Oran and Hutton Elizabeth S
Bought by
Feibusch Marianne C
Home Financials for this Owner
Home Financials are based on the most recent Mortgage that was taken out on this home.
Original Mortgage
$112,000
Outstanding Balance
$18,136
Interest Rate
7.54%
Estimated Equity
$732,030
Purchase Details
Closed on
Jul 27, 1995
Sold by
Hutton Elizabeth S and Hill Kate
Bought by
Hutton W Oran and Hutton Elizabeth S
Home Financials for this Owner
Home Financials are based on the most recent Mortgage that was taken out on this home.
Original Mortgage
$149,500
Interest Rate
7.62%
Create a Home Valuation Report for This Property
The Home Valuation Report is an in-depth analysis detailing your home's value as well as a comparison with similar homes in the area
Home Values in the Area
Average Home Value in this Area
Purchase History
| Date | Buyer | Sale Price | Title Company |
|---|---|---|---|
| Feibusch Marianne C | -- | North Bay Title Co | |
| Feibusch Marianne C | $227,000 | North Bay Title Co | |
| Hutton W Oran | -- | North Bay Title Co |
Source: Public Records
Mortgage History
| Date | Status | Borrower | Loan Amount |
|---|---|---|---|
| Open | Feibusch Marianne C | $112,000 | |
| Previous Owner | Hutton W Oran | $149,500 |
Source: Public Records
Tax History Compared to Growth
Tax History
| Year | Tax Paid | Tax Assessment Tax Assessment Total Assessment is a certain percentage of the fair market value that is determined by local assessors to be the total taxable value of land and additions on the property. | Land | Improvement |
|---|---|---|---|---|
| 2025 | $4,106 | $362,441 | $119,743 | $242,698 |
| 2024 | $4,106 | $355,336 | $117,396 | $237,940 |
| 2023 | $4,106 | $348,370 | $115,095 | $233,275 |
| 2022 | $3,793 | $341,540 | $112,839 | $228,701 |
| 2021 | $3,747 | $334,844 | $110,627 | $224,217 |
| 2020 | $3,739 | $331,411 | $109,493 | $221,918 |
| 2019 | $3,720 | $324,914 | $107,347 | $217,567 |
| 2018 | $3,699 | $318,544 | $105,243 | $213,301 |
| 2017 | $3,633 | $312,299 | $103,180 | $209,119 |
| 2016 | $3,604 | $306,176 | $101,157 | $205,019 |
| 2015 | $3,497 | $301,578 | $99,638 | $201,940 |
| 2014 | $3,284 | $295,672 | $97,687 | $197,985 |
Source: Public Records
Map
Nearby Homes
- 1605 Charlene Place
- 1763 Eardley Ave
- 1715 Ridley Ave
- 1239 Eardley Ave
- 2024 Elson Way
- 1736 Ensenada Ct
- 1166 Healey Ct
- 1552 Moonview Ct
- 2334 Iroquois St
- 1744 Marlow Rd
- 1154 Adrienne Way
- 1080 Tijuana Ct
- 2513 Westberry Dr
- 759 Simpson Place
- 788 Simpson Place
- 713 Blair Place
- 1580 Herbert St
- 706 Simpson Place
- 2529 Coffey Ln
- 2597 Northcoast St
- 1338 Jennings Park Way
- 1332 Jennings Park Way
- 1330 Jennings Park Way
- 1340 Jennings Park Way
- 1321 Jennings Park Way
- 1324 Jennings Park Way
- 1335 Jennings Park Way
- 1313 Jennings Park Way
- 1635 Clover Ln
- 1345 Jennings Park Way
- 1318 Jennings Park Way
- 1639 Clover Ln
- 1307 Jennings Park Way
- 1646 Jennings Ave
- 1631 Clover Ln
- 1312 Jennings Park Way
- 1638 Jennings Ave
- 1627 Clover Ln
- 1640 Jennings Ave
- 1656 Jennings Ave