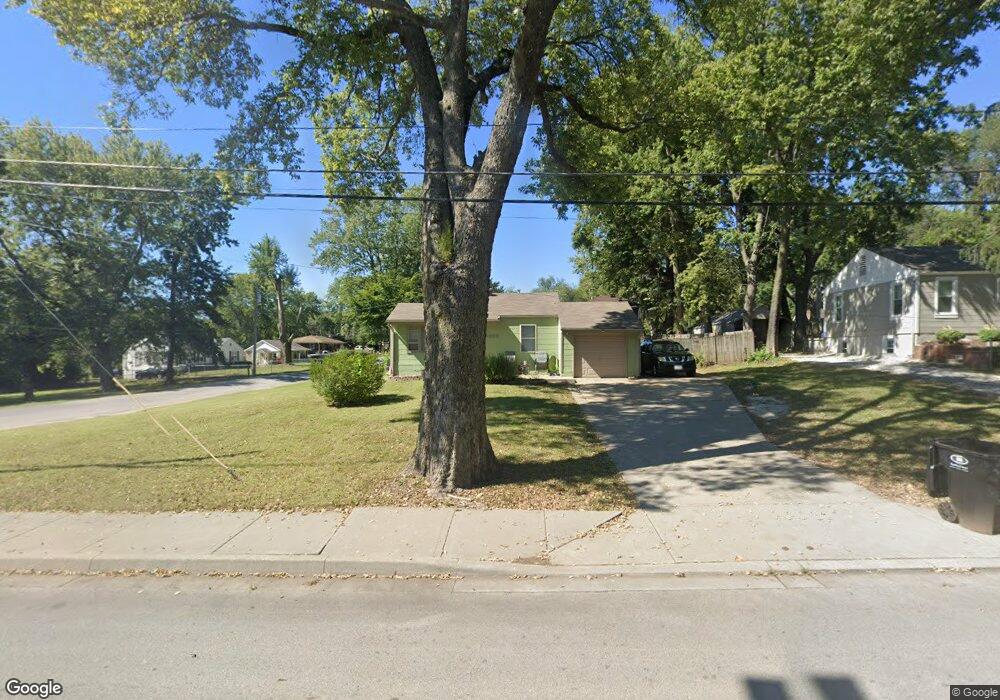
1336 S Mccoy St Independence, MO 64055
Three Trails NeighborhoodEstimated Value: $171,000 - $191,573
3
Beds
2
Baths
1,097
Sq Ft
$165/Sq Ft
Est. Value
About This Home
This home is located at 1336 S Mccoy St, Independence, MO 64055 and is currently estimated at $181,143, approximately $165 per square foot. 1336 S Mccoy St is a home located in Jackson County with nearby schools including Santa Fe Trail Elementary School, Bridger Middle School, and Pioneer Ridge Middle School.
Ownership History
Date
Name
Owned For
Owner Type
Purchase Details
Closed on
Aug 16, 2014
Sold by
Volz Nicole Renee and Keller Sarah L
Bought by
Volz Daniel Andrew and Volz Nicole Renee
Current Estimated Value
Home Financials for this Owner
Home Financials are based on the most recent Mortgage that was taken out on this home.
Original Mortgage
$76,275
Outstanding Balance
$43,398
Interest Rate
3.82%
Mortgage Type
FHA
Estimated Equity
$137,745
Purchase Details
Closed on
Jul 12, 2005
Sold by
Merrill Scott A
Bought by
Keller Nicole R and Keller Sarah L
Home Financials for this Owner
Home Financials are based on the most recent Mortgage that was taken out on this home.
Original Mortgage
$89,195
Interest Rate
5.58%
Mortgage Type
FHA
Purchase Details
Closed on
Dec 20, 1996
Sold by
Forbes Bonnie and Forbes Stephen
Bought by
Merrill Scott S and Merrill Kelli
Create a Home Valuation Report for This Property
The Home Valuation Report is an in-depth analysis detailing your home's value as well as a comparison with similar homes in the area
Home Values in the Area
Average Home Value in this Area
Purchase History
| Date | Buyer | Sale Price | Title Company |
|---|---|---|---|
| Volz Daniel Andrew | -- | First American Title Ins Co | |
| Keller Nicole R | -- | First American Title Ins Co | |
| Merrill Scott S | -- | Chicago Title Insurance Co |
Source: Public Records
Mortgage History
| Date | Status | Borrower | Loan Amount |
|---|---|---|---|
| Open | Volz Daniel Andrew | $76,275 | |
| Closed | Keller Nicole R | $89,195 |
Source: Public Records
Tax History Compared to Growth
Tax History
| Year | Tax Paid | Tax Assessment Tax Assessment Total Assessment is a certain percentage of the fair market value that is determined by local assessors to be the total taxable value of land and additions on the property. | Land | Improvement |
|---|---|---|---|---|
| 2025 | $1,617 | $21,609 | $4,347 | $17,262 |
| 2024 | $1,580 | $23,332 | $4,296 | $19,036 |
| 2023 | $1,580 | $23,333 | $1,777 | $21,556 |
| 2022 | $1,207 | $16,340 | $3,179 | $13,161 |
| 2021 | $1,206 | $16,340 | $3,179 | $13,161 |
| 2020 | $1,239 | $16,306 | $3,179 | $13,127 |
| 2019 | $1,219 | $16,306 | $3,179 | $13,127 |
| 2018 | $1,111 | $14,191 | $2,767 | $11,424 |
| 2017 | $1,094 | $14,191 | $2,767 | $11,424 |
| 2016 | $1,094 | $13,836 | $2,544 | $11,292 |
| 2014 | $1,040 | $13,433 | $2,470 | $10,963 |
Source: Public Records
Map
Nearby Homes
- 701 W 24th St
- 832 W Charles St
- 1337 S Osage St
- 1335 S Osage St
- 1215 S Delaware Ave
- 1226 Windsor St
- 1511 W 23rd St S
- 712 W 23rd St S
- 1224 Windsor St
- 1216 S Osage St
- 1223 S Osage St
- 1215 S Osage St
- 1424 S Liberty St
- 1130 W 27th St S
- 501 W South Ave
- 1106 S Osage St
- 1218 W 25th Terrace S
- 1815 & 1719 S Osage St
- 1220 W 26th St S
- 908 S Delaware St
- 616 W Charles St
- 1334 S Mccoy St
- 601 W Charles St
- 1332 S Mccoy St
- 618 W Charles St
- 1325 S Mccoy St
- 1330 S Mccoy St
- 1315 S Mccoy St
- 1400 S Mccoy St
- 1311 S Mccoy St
- 1401 S Mccoy St
- 622 W Charles St
- 619 W Charles St
- 615 W Charles St
- 1309 S Mccoy St
- 623 W Charles St
- 1312 S Mccoy St
- 626 W Charles St
- 1405 S Mccoy St