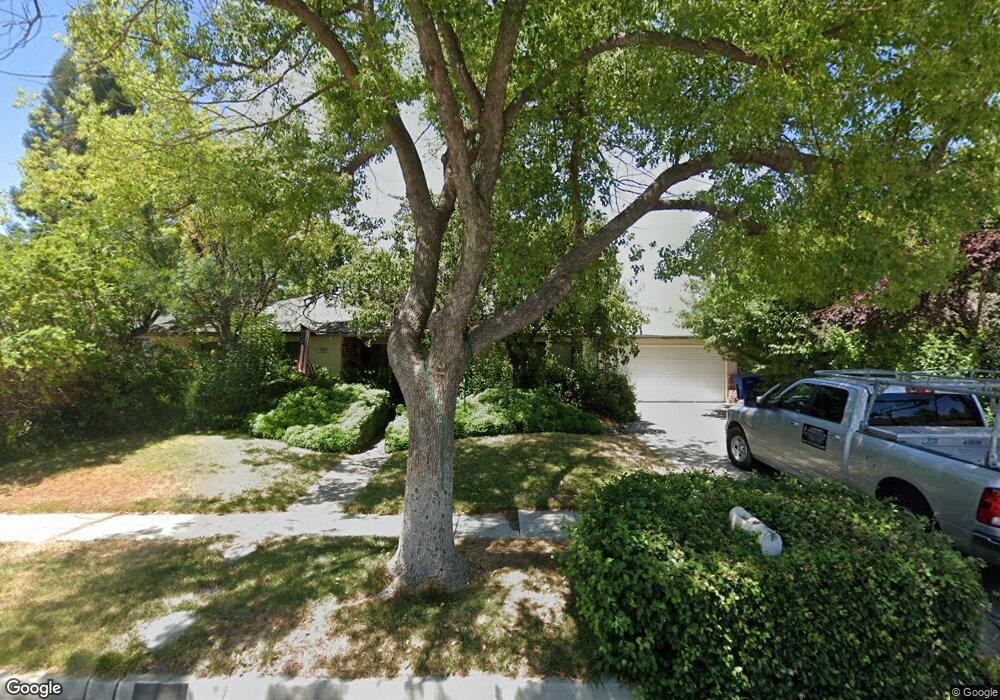
1336 W Fremont Ave Fresno, CA 93711
Bullard NeighborhoodEstimated Value: $473,000 - $523,000
3
Beds
2
Baths
1,860
Sq Ft
$264/Sq Ft
Est. Value
About This Home
This home is located at 1336 W Fremont Ave, Fresno, CA 93711 and is currently estimated at $490,585, approximately $263 per square foot. 1336 W Fremont Ave is a home located in Fresno County with nearby schools including Starr Elementary School, Tenaya Middle School, and Bullard High School.
Ownership History
Date
Name
Owned For
Owner Type
Purchase Details
Closed on
Oct 9, 2017
Sold by
Zweigle Linda S
Bought by
Zweigle Linda Sue and Linda Sue Zweigle Revocable Trust
Current Estimated Value
Purchase Details
Closed on
Oct 14, 2003
Sold by
Cain Joel H
Bought by
Zweigle Linda S
Home Financials for this Owner
Home Financials are based on the most recent Mortgage that was taken out on this home.
Original Mortgage
$153,000
Outstanding Balance
$71,056
Interest Rate
6.14%
Mortgage Type
Purchase Money Mortgage
Estimated Equity
$419,529
Purchase Details
Closed on
May 24, 1995
Sold by
Anshutz James D and Anshutz Sally A
Bought by
Cain Joel H and Zweigle Linda S
Home Financials for this Owner
Home Financials are based on the most recent Mortgage that was taken out on this home.
Original Mortgage
$104,000
Interest Rate
8.32%
Create a Home Valuation Report for This Property
The Home Valuation Report is an in-depth analysis detailing your home's value as well as a comparison with similar homes in the area
Home Values in the Area
Average Home Value in this Area
Purchase History
| Date | Buyer | Sale Price | Title Company |
|---|---|---|---|
| Zweigle Linda Sue | -- | None Available | |
| Zweigle Linda S | -- | Stewart Title Of Fresno Cnty | |
| Cain Joel H | $130,000 | North American Title Company |
Source: Public Records
Mortgage History
| Date | Status | Borrower | Loan Amount |
|---|---|---|---|
| Open | Zweigle Linda S | $153,000 | |
| Previous Owner | Cain Joel H | $104,000 |
Source: Public Records
Tax History Compared to Growth
Tax History
| Year | Tax Paid | Tax Assessment Tax Assessment Total Assessment is a certain percentage of the fair market value that is determined by local assessors to be the total taxable value of land and additions on the property. | Land | Improvement |
|---|---|---|---|---|
| 2025 | $3,183 | $261,286 | $64,926 | $196,360 |
| 2023 | $3,183 | $251,141 | $62,405 | $188,736 |
| 2022 | $3,076 | $246,218 | $61,182 | $185,036 |
| 2021 | $2,990 | $241,391 | $59,983 | $181,408 |
| 2020 | $2,976 | $238,916 | $59,368 | $179,548 |
| 2019 | $2,860 | $234,232 | $58,204 | $176,028 |
| 2018 | $2,796 | $229,640 | $57,063 | $172,577 |
| 2017 | $2,746 | $225,139 | $55,945 | $169,194 |
| 2016 | $2,654 | $220,726 | $54,849 | $165,877 |
| 2015 | $2,612 | $217,412 | $54,026 | $163,386 |
| 2014 | $2,560 | $213,154 | $52,968 | $160,186 |
Source: Public Records
Map
Nearby Homes
- 6658 N Thorne Ave
- 6594 N Farris Ave
- 6737 N Harrison Ave
- 6569 N Teilman Ave
- 1 Palm Ave
- 7166 N Fruit Ave Unit 160
- 7166 N Fruit Ave Unit 132
- 7178 N Fruit Ave Unit 108
- 7166 N Fruit Ave Unit 127
- 6671 N Channing Way
- 1041 W Sierra Ave
- 7047 N Teilman Ave Unit 101
- 7047 N Teilman Ave Unit 102
- 744 W Palo Altp Ave
- 744 W Magill Ave
- 1387 W Sample Ave
- 1067 W Minarets Ave
- 1654 W Vartikian Ave
- 1590 W Escalon Ave
- 1611 W Escalon Ave
- 1324 W Fremont Ave
- 1348 W Fremont Ave
- 1337 W Magill Ave
- 1349 W Magill Ave
- 1325 W Magill Ave
- 1360 W Fremont Ave
- 1312 W Fremont Ave
- 1335 W Fremont Ave
- 1347 W Fremont Ave
- 1361 W Magill Ave
- 1321 W Fremont Ave
- 1311 W Magill Ave
- 1359 W Fremont Ave
- 1372 W Fremont Ave
- 1298 W Fremont Ave
- 1373 W Magill Ave
- 1299 W Magill Ave
- 1328 W Palo Alto Ave
- 1334 W Magill Ave
- 1340 W Palo Alto Ave