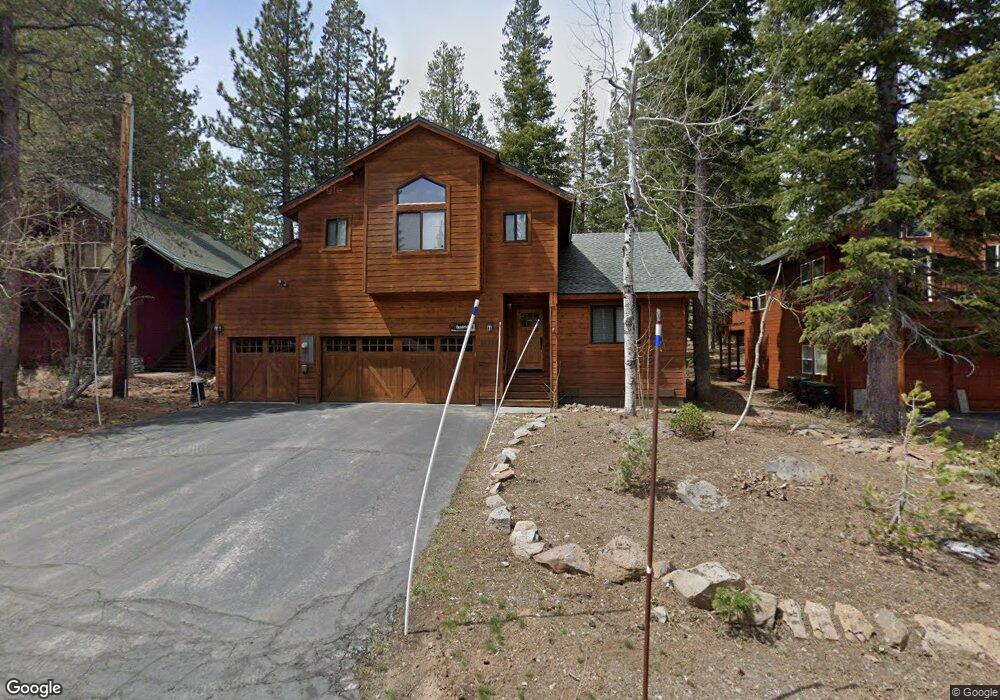
13365 Ski View Loop Truckee, CA 96161
Tahoe Donner NeighborhoodEstimated Value: $986,722 - $1,293,000
3
Beds
3
Baths
1,999
Sq Ft
$548/Sq Ft
Est. Value
About This Home
This home is located at 13365 Ski View Loop, Truckee, CA 96161 and is currently estimated at $1,095,181, approximately $547 per square foot. 13365 Ski View Loop is a home located in Nevada County with nearby schools including Truckee Elementary School, Alder Creek Middle School, and Tahoe Truckee High School.
Ownership History
Date
Name
Owned For
Owner Type
Purchase Details
Closed on
May 24, 2019
Sold by
Hendricks Matthew L and Hendricks Kelly G
Bought by
Hendricks Family Trust
Current Estimated Value
Purchase Details
Closed on
Nov 3, 2007
Sold by
Grasham Ross H and Grasham Beatrice C
Bought by
Hendricks Matthew L and Hendricks Kelly G
Purchase Details
Closed on
Jun 4, 1999
Sold by
Hendricks Matt L and Hendricks Kelly G
Bought by
Hendricks Matt L and Hendricks Kelly G
Home Financials for this Owner
Home Financials are based on the most recent Mortgage that was taken out on this home.
Original Mortgage
$167,000
Interest Rate
6.9%
Mortgage Type
Purchase Money Mortgage
Purchase Details
Closed on
Jun 3, 1999
Sold by
Ford Leland E and Ford Eleanor
Bought by
Hendricks Matt L and Hendricks Kelly G
Home Financials for this Owner
Home Financials are based on the most recent Mortgage that was taken out on this home.
Original Mortgage
$167,000
Interest Rate
6.9%
Mortgage Type
Purchase Money Mortgage
Create a Home Valuation Report for This Property
The Home Valuation Report is an in-depth analysis detailing your home's value as well as a comparison with similar homes in the area
Home Values in the Area
Average Home Value in this Area
Purchase History
| Date | Buyer | Sale Price | Title Company |
|---|---|---|---|
| Hendricks Family Trust | -- | None Available | |
| Hendricks Matthew L | -- | None Available | |
| Hendricks Matt L | -- | First California Title Co | |
| Hendricks Matt L | $317,000 | Fidelity National Title |
Source: Public Records
Mortgage History
| Date | Status | Borrower | Loan Amount |
|---|---|---|---|
| Previous Owner | Hendricks Matt L | $167,000 |
Source: Public Records
Tax History
| Year | Tax Paid | Tax Assessment Tax Assessment Total Assessment is a certain percentage of the fair market value that is determined by local assessors to be the total taxable value of land and additions on the property. | Land | Improvement |
|---|---|---|---|---|
| 2025 | $6,896 | $499,948 | $81,379 | $418,569 |
| 2024 | $6,801 | $490,146 | $79,784 | $410,362 |
| 2023 | $6,801 | $480,536 | $78,220 | $402,316 |
| 2022 | $6,586 | $471,115 | $76,687 | $394,428 |
| 2021 | $6,244 | $461,820 | $75,125 | $386,695 |
| 2020 | $6,196 | $457,085 | $74,355 | $382,730 |
| 2019 | $6,184 | $448,124 | $72,898 | $375,226 |
| 2018 | $5,653 | $439,338 | $71,469 | $367,869 |
| 2017 | $5,517 | $430,728 | $70,072 | $360,656 |
| 2016 | $5,463 | $421,514 | $67,929 | $353,585 |
| 2015 | $5,341 | $415,185 | $66,911 | $348,274 |
| 2014 | $5,341 | $407,054 | $65,602 | $341,452 |
Source: Public Records
Map
Nearby Homes
- 14258 Glacier View Dr
- 14096 Ramshorn St
- 14653 Northwoods Blvd
- 14579 Northwoods Blvd
- 13239 Northwoods Blvd Unit B
- 13205 Northwoods Blvd Unit 2
- 11926 Rhineland Ave
- 14820 Davos Dr
- 13420 Northwoods Blvd
- 13257 Ski Slope Way
- 15310 Northwoods Blvd
- 13938 Northwoods Blvd
- 13854 Northwoods Blvd
- 11566 Rhineland Ave
- 13038 Ski Slope Way
- 14487 Ski Slope Way
- 13418 Heidi Way
- 11870 Muhlebach Way Unit 1
- 14165 Copenhagen Dr
- 12574 Saint Moritz Ln
- 13355 Skiview Loop
- 13389 Ski View Loop
- 13354 Ski View Loop
- 13366 Ski View Loop Unit 11
- 13366 Ski View Loop
- 13377 Ski View Loop
- 13342 Ski View Loop
- 13335 Ski View Loop
- 13390 Ski View Loop
- 14761 Tyrol Rd
- 14749 Tyrol Rd
- 13435 Ski View Loop
- 13336 Ski View Loop
- 13428 Ski View Loop
- 14067 Glacier View Dr
- 14741 Tyrol Rd
- 14781 Tyrol Rd
- 14081 Glacier View Dr Unit 4
- 14081 Glacier View Dr
- 13442 Ski View Loop
Your Personal Tour Guide
Ask me questions while you tour the home.