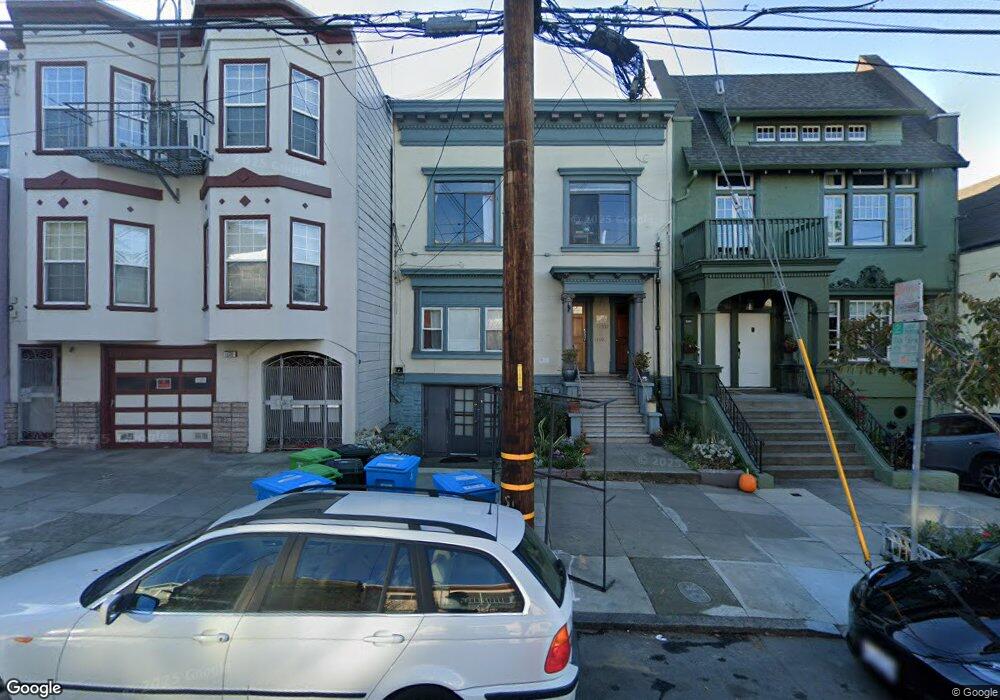
1337 8th Ave Unit 1339 San Francisco, CA 94122
Inner Sunset NeighborhoodEstimated Value: $1,397,000 - $2,008,000
--
Bed
3
Baths
1,800
Sq Ft
$990/Sq Ft
Est. Value
About This Home
This home is located at 1337 8th Ave Unit 1339, San Francisco, CA 94122 and is currently estimated at $1,782,333, approximately $990 per square foot. 1337 8th Ave Unit 1339 is a home located in San Francisco County with nearby schools including Grattan Elementary, Giannini (A.P.) Middle School, and St Anne School.
Ownership History
Date
Name
Owned For
Owner Type
Purchase Details
Closed on
Dec 26, 2022
Sold by
Maloney Sarah A
Bought by
Goodwin Nathaniel J
Current Estimated Value
Purchase Details
Closed on
Jul 18, 2016
Sold by
Goodwin Susan M
Bought by
Maloney Sarah A and Goodwin Nathaniel J
Purchase Details
Closed on
Nov 17, 2015
Sold by
Goodwin Susan M
Bought by
Goodwin Susan M
Purchase Details
Closed on
Jun 25, 2013
Sold by
Goodwin James W and Goodwin Susan M
Bought by
Goodwin James W and Goodwin Susan M
Purchase Details
Closed on
Feb 10, 2011
Sold by
Galassi Susan C and Goodwin Raymond G
Bought by
Goodwin James W
Purchase Details
Closed on
Jan 12, 2009
Sold by
Galassi Susan C and Goodwin Raymond G
Bought by
Galassi Susan C and Goodwin Raymond G
Create a Home Valuation Report for This Property
The Home Valuation Report is an in-depth analysis detailing your home's value as well as a comparison with similar homes in the area
Home Values in the Area
Average Home Value in this Area
Purchase History
| Date | Buyer | Sale Price | Title Company |
|---|---|---|---|
| Goodwin Nathaniel J | -- | None Listed On Document | |
| Maloney Sarah A | -- | None Listed On Document | |
| Maloney Sarah A | -- | None Available | |
| Goodwin Susan M | $780,000 | Fidelity National Title Co | |
| Goodwin James W | -- | None Available | |
| Goodwin James W | -- | None Available | |
| Goodwin James W | -- | None Available | |
| Galassi Susan C | -- | None Available |
Source: Public Records
Tax History Compared to Growth
Tax History
| Year | Tax Paid | Tax Assessment Tax Assessment Total Assessment is a certain percentage of the fair market value that is determined by local assessors to be the total taxable value of land and additions on the property. | Land | Improvement |
|---|---|---|---|---|
| 2025 | $3,720 | $210,453 | $71,593 | $138,589 |
| 2024 | $3,720 | $206,333 | $70,190 | $135,872 |
| 2023 | $3,523 | $202,293 | $68,814 | $133,208 |
| 2022 | $3,398 | $198,272 | $67,446 | $130,586 |
| 2021 | $3,338 | $194,390 | $66,124 | $128,266 |
| 2020 | $3,526 | $192,740 | $65,446 | $127,294 |
| 2019 | $3,427 | $188,974 | $64,164 | $124,810 |
| 2018 | $3,333 | $185,282 | $62,906 | $122,376 |
| 2017 | $3,001 | $181,662 | $61,674 | $119,988 |
| 2016 | $2,916 | $178,106 | $60,463 | $117,643 |
| 2015 | $2,875 | $175,441 | $59,556 | $115,885 |
| 2014 | $2,810 | $172,017 | $58,390 | $113,627 |
Source: Public Records
Map
Nearby Homes
- 1360 9th Ave Unit 7
- 1300 7th Ave Unit 1
- 652 Parnassus Ave
- 1264 3rd Ave
- 1392 Funston Ave
- 1515 11th Ave
- 1228 Funston Ave
- 40 Irving St
- 1635 10th Ave Unit 5
- 450 Carl St
- 327 Crestmont Dr Unit 329
- 327-329 Crestmont Dr
- 683 Frederick St
- 1723-1725 7th Ave
- 1349 17th Ave
- 124 Noriega St
- 1701 Funston Ave Unit 1703
- 1808 8th Ave Unit 1810
- 1810 8th Ave
- 1346 Judah St