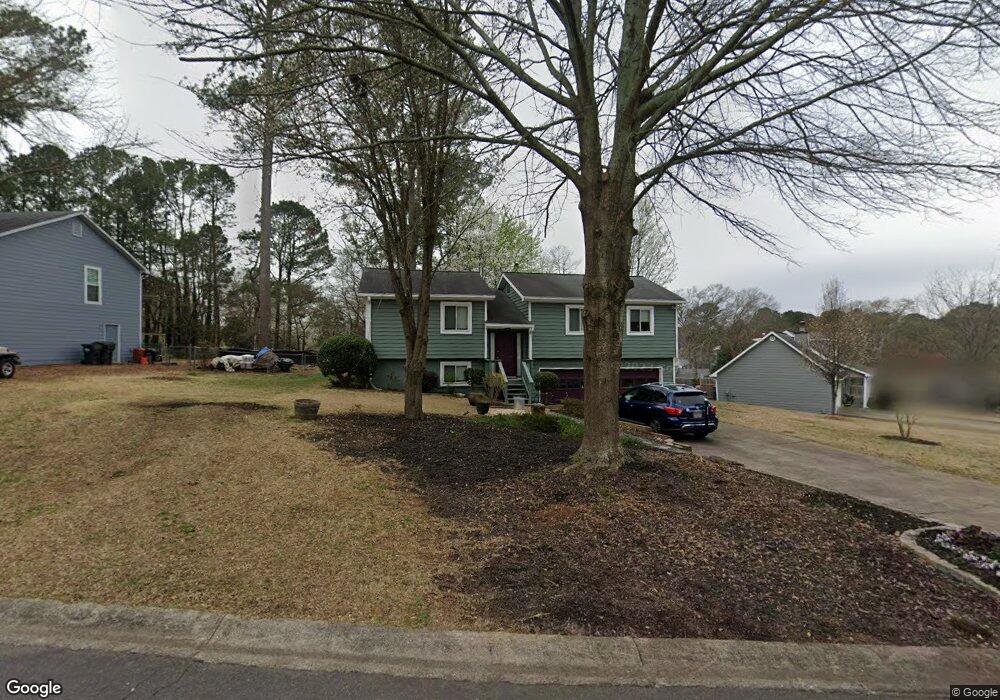
1337 Shaw Dr NE Unit 5 Marietta, GA 30066
Sandy Plains NeighborhoodEstimated Value: $350,962 - $393,000
3
Beds
2
Baths
1,290
Sq Ft
$285/Sq Ft
Est. Value
About This Home
This home is located at 1337 Shaw Dr NE Unit 5, Marietta, GA 30066 and is currently estimated at $367,491, approximately $284 per square foot. 1337 Shaw Dr NE Unit 5 is a home located in Cobb County with nearby schools including Addison Elementary School, Daniell Middle School, and Sprayberry High School.
Ownership History
Date
Name
Owned For
Owner Type
Purchase Details
Closed on
Mar 2, 2022
Sold by
Geertruida Disseldorp
Bought by
Edwards Ann Marie
Current Estimated Value
Home Financials for this Owner
Home Financials are based on the most recent Mortgage that was taken out on this home.
Original Mortgage
$314,204
Outstanding Balance
$292,253
Interest Rate
3.69%
Mortgage Type
FHA
Estimated Equity
$75,238
Purchase Details
Closed on
Mar 30, 1999
Sold by
Overduijn Gertruida
Bought by
Disseldorp Geertruida
Home Financials for this Owner
Home Financials are based on the most recent Mortgage that was taken out on this home.
Original Mortgage
$108,000
Interest Rate
6.85%
Mortgage Type
New Conventional
Purchase Details
Closed on
Nov 30, 1995
Sold by
Mautz Diane M David L
Bought by
Overduijn Geertruida
Create a Home Valuation Report for This Property
The Home Valuation Report is an in-depth analysis detailing your home's value as well as a comparison with similar homes in the area
Home Values in the Area
Average Home Value in this Area
Purchase History
| Date | Buyer | Sale Price | Title Company |
|---|---|---|---|
| Edwards Ann Marie | $320,000 | None Listed On Document | |
| Disseldorp Geertruida | -- | -- | |
| Overduijn Geertruida | $97,500 | -- |
Source: Public Records
Mortgage History
| Date | Status | Borrower | Loan Amount |
|---|---|---|---|
| Open | Edwards Ann Marie | $314,204 | |
| Previous Owner | Disseldorp Geertruida | $108,000 | |
| Closed | Overduijn Geertruida | $0 |
Source: Public Records
Tax History Compared to Growth
Tax History
| Year | Tax Paid | Tax Assessment Tax Assessment Total Assessment is a certain percentage of the fair market value that is determined by local assessors to be the total taxable value of land and additions on the property. | Land | Improvement |
|---|---|---|---|---|
| 2025 | $4,295 | $142,560 | $36,000 | $106,560 |
| 2024 | $3,584 | $118,876 | $28,800 | $90,076 |
| 2023 | $3,584 | $118,876 | $28,800 | $90,076 |
| 2022 | $570 | $97,500 | $20,800 | $76,700 |
| 2021 | $544 | $88,992 | $19,600 | $69,392 |
| 2020 | $514 | $78,952 | $19,600 | $59,352 |
| 2019 | $499 | $73,684 | $19,600 | $54,084 |
| 2018 | $499 | $73,684 | $19,600 | $54,084 |
| 2017 | $427 | $66,132 | $24,000 | $42,132 |
| 2016 | $430 | $66,132 | $24,000 | $42,132 |
| 2015 | $458 | $66,132 | $24,000 | $42,132 |
| 2014 | $435 | $57,336 | $0 | $0 |
Source: Public Records
Map
Nearby Homes
- 2839 Pine Meadow Dr
- 2642 Morgan Rd NE
- 1597 Sprayberry Dr
- 2742 Bob Bettis Rd
- 1756 Brown Cir
- 1748 Brown Cir
- 2904 Goldfinch Cir
- 2931 Leasa Ct
- 1611 Northwoods Dr
- 1814 Chasewood Park Dr
- 2725 Stillwater Lake Ln Unit 2
- 921 Chesterfield Dr
- 922 Red Apple Dr
- 3030 Rio Montana Dr
- 1829 Chasewood Park Dr
- 1100 Sallete Ct
- 1184 Alemeda Dr
- 2314 Sandy Oaks Dr
- 2116 Morgan Rd NE
- 1494 Oak Springs Dr
- 1335 Shaw Dr NE Unit 5
- 1341 Shaw Dr NE
- 1345 Shaw Dr NE
- 2658 Shaw Rd NE
- 2660 Shaw Rd NE
- 1338 Shaw Dr NE
- 1334 Shaw Dr NE
- 1336 Shaw Dr NE
- 1340 Shaw Dr NE Unit 5
- 2656 Shaw Rd NE Unit 1/3
- 2656 Shaw Rd NE
- 2654 Shaw Rd NE
- 1349 Shaw Dr NE
- 1342 Shaw Dr NE
- 2652 Shaw Rd NE
- 2664 Shaw Rd NE
- 1344 Shaw Dr NE Unit 6
- 2650 Shaw Rd NE
- 2839 Pine Meadow Dr Unit 4
- 2837 Pine Meadow Dr