
Seller's Agent in 2022
Charlie Armstrong
NAI Ruhl Commercial Company
(563) 529-6600
1 in this area
44 Total Sales
Estimated Value: $582,318
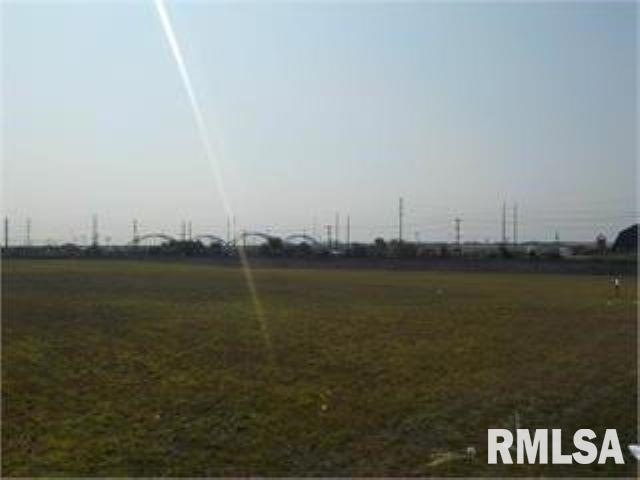
18.15 acre land sale including two industrial zoned lots totaling 13.6 acres and fourteen miscellaneous zoned lot totaling 4.55 acres. For comp purposes only.
Last Agent to Sell the Property
NAI Ruhl Commercial Company License #S41067000/475.130998 Listed on: 03/09/2022
| Date | Event | Price | List to Sale | Price per Sq Ft |
|---|---|---|---|---|
| 09/29/2022 09/29/22 | Sold | $500,000 | 0.0% | -- |
| 03/09/2022 03/09/22 | For Sale | $500,000 | -- | -- |
| Year | Tax Paid | Tax Assessment Tax Assessment Total Assessment is a certain percentage of the fair market value that is determined by local assessors to be the total taxable value of land and additions on the property. | Land | Improvement |
|---|---|---|---|---|
| 2025 | $15,102 | $504,700 | $332,440 | $172,260 |
| 2024 | $15,032 | $504,700 | $332,440 | $172,260 |
| 2023 | $16,464 | $504,700 | $332,440 | $172,260 |
| 2022 | $17,348 | $523,560 | $332,440 | $191,120 |
| 2021 | $17,348 | $564,300 | $332,440 | $231,860 |
| 2020 | $267,388 | $7,616,940 | $332,440 | $7,284,500 |
| 2019 | $266,950 | $7,616,940 | $332,440 | $7,284,500 |
| 2018 | $267,434 | $7,616,940 | $332,440 | $7,284,500 |
| 2017 | $274,316 | $7,616,940 | $332,440 | $7,284,500 |
| 2016 | $271,937 | $7,675,100 | $0 | $0 |
| 2015 | $268,498 | $7,675,100 | $0 | $0 |
| 2014 | $272,734 | $7,675,100 | $0 | $0 |
| 2013 | $292,540 | $0 | $0 | $0 |
| 2012 | -- | $10,746,176 | $428,600 | $10,317,576 |
Seller's Agent in 2022
Charlie Armstrong
NAI Ruhl Commercial Company
(563) 529-6600
1 in this area
44 Total Sales
Buyer's Agent in 2022
John Ruhl
NAI Ruhl Commercial Company
(563) 823-5126
3 in this area
23 Total Sales
Source: RMLS Alliance
MLS Number: RMAQC4239254
APN: K0009-06
Disclaimer: Certain information contained herein is derived from information provided by parties other than Homes.com. All information provided is deemed reliable, but is not guaranteed to be accurate and should be independently verified.
![]() IDX information is provided exclusively for personal, non-commercial use, and may not be used for any purpose other than to identify prospective properties consumers may be interested in purchasing. Information is deemed reliable but not guaranteed.
IDX information is provided exclusively for personal, non-commercial use, and may not be used for any purpose other than to identify prospective properties consumers may be interested in purchasing. Information is deemed reliable but not guaranteed.