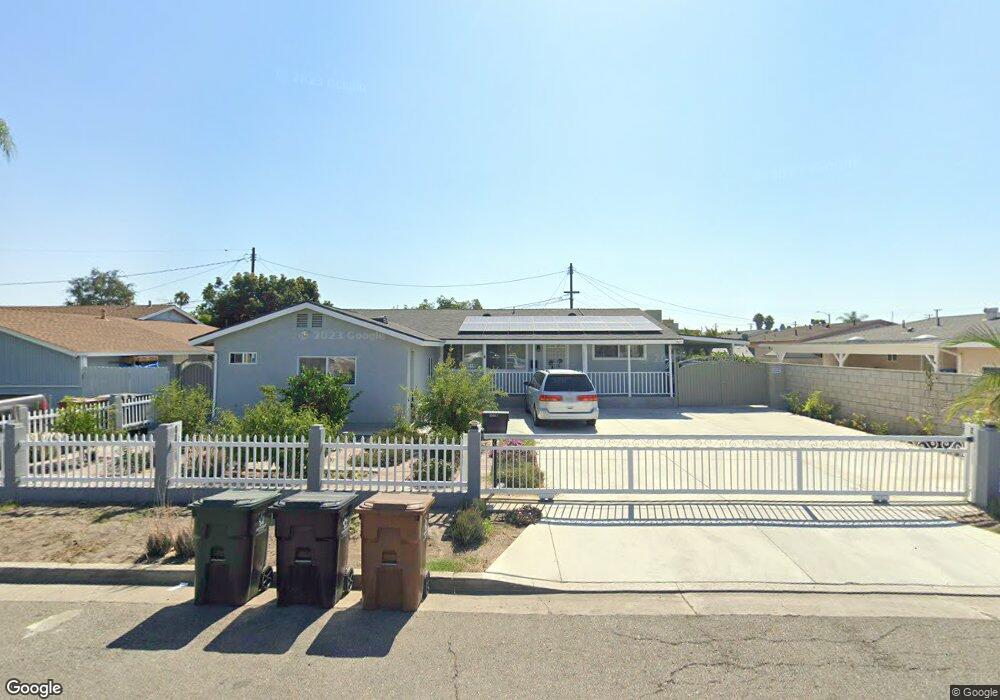
13372 Kelly St Garden Grove, CA 92844
Estimated Value: $917,000 - $988,000
4
Beds
2
Baths
1,139
Sq Ft
$826/Sq Ft
Est. Value
About This Home
This home is located at 13372 Kelly St, Garden Grove, CA 92844 and is currently estimated at $941,372, approximately $826 per square foot. 13372 Kelly St is a home located in Orange County with nearby schools including Sunnyside Elementary School, Donald S. Jordan Intermediate School, and Bolsa Grande High School.
Ownership History
Date
Name
Owned For
Owner Type
Purchase Details
Closed on
Nov 24, 2023
Sold by
Pham Hieu T and Pham Hong T
Bought by
Pham Living Trust and Pham
Current Estimated Value
Purchase Details
Closed on
Aug 20, 2019
Sold by
Nguyen Christopher N and Pham Christine T
Bought by
Pham Hieu T and Pham Hong T
Purchase Details
Closed on
Mar 13, 2019
Sold by
Oaktree Investments Inc
Bought by
Nguyen Christopher N and Pham Christine T
Home Financials for this Owner
Home Financials are based on the most recent Mortgage that was taken out on this home.
Original Mortgage
$460,000
Interest Rate
4.3%
Mortgage Type
New Conventional
Purchase Details
Closed on
Jul 16, 2018
Sold by
Quality Loan Service Corporation
Bought by
Oak Tree Investment Inc
Purchase Details
Closed on
Aug 21, 2007
Sold by
Mclane Myrnalee
Bought by
Mclane Melody
Create a Home Valuation Report for This Property
The Home Valuation Report is an in-depth analysis detailing your home's value as well as a comparison with similar homes in the area
Home Values in the Area
Average Home Value in this Area
Purchase History
| Date | Buyer | Sale Price | Title Company |
|---|---|---|---|
| Pham Living Trust | -- | None Listed On Document | |
| Pham Hieu T | -- | None Available | |
| Nguyen Christopher N | $575,000 | First American Title Company | |
| Oak Tree Investment Inc | $480,500 | None Available | |
| Mclane Melody | -- | None Available |
Source: Public Records
Mortgage History
| Date | Status | Borrower | Loan Amount |
|---|---|---|---|
| Previous Owner | Nguyen Christopher N | $460,000 |
Source: Public Records
Tax History Compared to Growth
Tax History
| Year | Tax Paid | Tax Assessment Tax Assessment Total Assessment is a certain percentage of the fair market value that is determined by local assessors to be the total taxable value of land and additions on the property. | Land | Improvement |
|---|---|---|---|---|
| 2025 | $9,195 | $753,759 | $573,616 | $180,143 |
| 2024 | $9,195 | $738,980 | $562,369 | $176,611 |
| 2023 | $9,107 | $724,491 | $551,342 | $173,149 |
| 2022 | $8,914 | $710,286 | $540,532 | $169,754 |
| 2021 | $8,820 | $696,359 | $529,933 | $166,426 |
| 2020 | $7,472 | $585,350 | $524,499 | $60,851 |
| 2019 | $6,089 | $480,500 | $422,319 | $58,181 |
| 2018 | $7,325 | $550,000 | $483,854 | $66,146 |
| 2017 | $6,911 | $513,000 | $446,854 | $66,146 |
| 2016 | $5,610 | $418,800 | $352,654 | $66,146 |
| 2015 | $5,608 | $418,800 | $352,654 | $66,146 |
| 2014 | $5,473 | $418,800 | $352,654 | $66,146 |
Source: Public Records
Map
Nearby Homes
- 13411 Magnolia St
- 13392 Magnolia St
- 8569 Edgebrook Dr
- 8833 Brookdale Dr
- 13252 Newland St Unit A-D
- 13175 Creek View Dr Unit F
- 8520 Lake Knoll Ave Unit B
- 8800 W Garden Grove Blvd Unit 2
- 8442 Trask Ave
- 8784 Hewitt Place Unit 12
- 13839 Magnolia St
- 13782 Newland St
- 9370 W Garden Grove Blvd
- 12941 Josephine St
- 12931 Josephine St
- 12861 Alamitos Way
- 13100 Gilbert St Unit 28
- 12892 Adelle St
- 13402 Wynant Dr
- 9200 Westminster Blvd Unit 25
- 13362 Kelly St
- 8841 Dakota Ave
- 8851 Dakota Ave
- 13371 Hazel St
- 13361 Hazel St
- 13352 Kelly St
- 8861 Dakota Ave
- 13371 Kelly St
- 8821 Dakota Ave
- 13361 Kelly St
- 13351 Hazel St
- 13342 Kelly St
- 13351 Kelly St
- 8801 Dakota Ave
- 13341 Hazel St
- 8842 Dakota Ave
- 8852 Dakota Ave
- 8832 Dakota Ave
- 13341 Kelly St
- 13372 Hale Ave