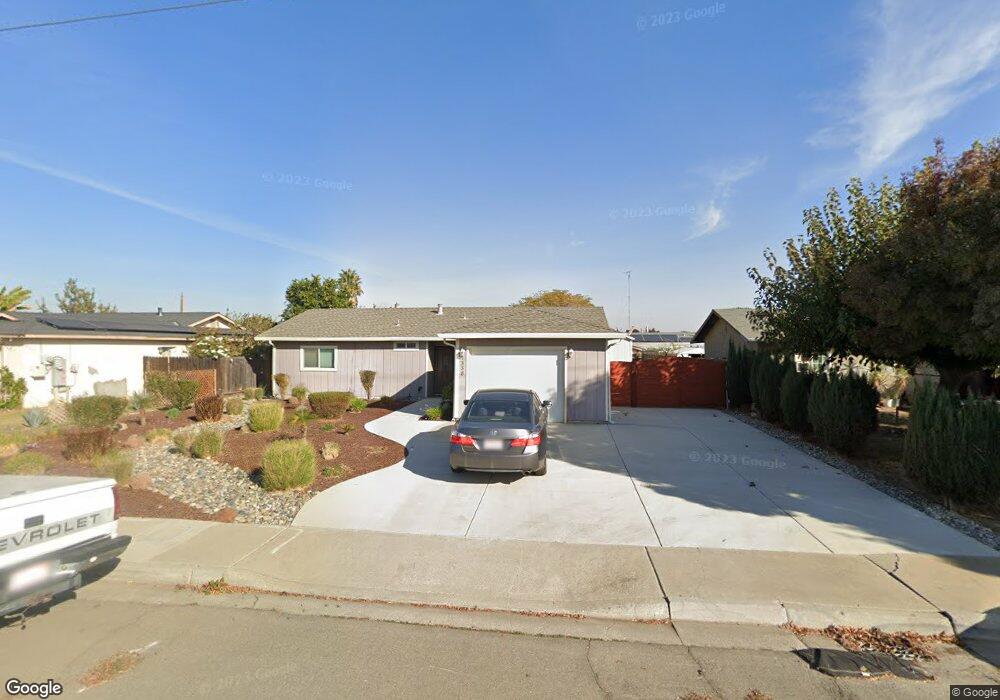
1338 Eucalyptus Ave Newman, CA 95360
Estimated Value: $277,000 - $415,000
3
Beds
1
Bath
1,032
Sq Ft
$338/Sq Ft
Est. Value
About This Home
This home is located at 1338 Eucalyptus Ave, Newman, CA 95360 and is currently estimated at $348,626, approximately $337 per square foot. 1338 Eucalyptus Ave is a home located in Stanislaus County with nearby schools including Orestimba High School.
Ownership History
Date
Name
Owned For
Owner Type
Purchase Details
Closed on
Oct 6, 2015
Sold by
Best Robin B and Best Antoinette K
Bought by
The Robin B Nest & Antoinette K Best 201
Current Estimated Value
Purchase Details
Closed on
Dec 11, 2003
Sold by
Best Robin Paul
Bought by
Best Robin B and Best Antoinette K
Home Financials for this Owner
Home Financials are based on the most recent Mortgage that was taken out on this home.
Original Mortgage
$75,000
Outstanding Balance
$35,117
Interest Rate
6.03%
Mortgage Type
Purchase Money Mortgage
Estimated Equity
$313,509
Purchase Details
Closed on
Sep 27, 1996
Sold by
Ruddles Deborah R
Bought by
Best Robin Paul
Home Financials for this Owner
Home Financials are based on the most recent Mortgage that was taken out on this home.
Original Mortgage
$72,962
Interest Rate
8.37%
Mortgage Type
FHA
Create a Home Valuation Report for This Property
The Home Valuation Report is an in-depth analysis detailing your home's value as well as a comparison with similar homes in the area
Home Values in the Area
Average Home Value in this Area
Purchase History
| Date | Buyer | Sale Price | Title Company |
|---|---|---|---|
| The Robin B Nest & Antoinette K Best 201 | -- | None Available | |
| Best Robin B | $129,000 | Stewart Title Of Modesto | |
| Best Robin Paul | $73,000 | Chicago Title Co |
Source: Public Records
Mortgage History
| Date | Status | Borrower | Loan Amount |
|---|---|---|---|
| Open | Best Robin B | $75,000 | |
| Closed | Best Robin Paul | $72,962 |
Source: Public Records
Tax History
| Year | Tax Paid | Tax Assessment Tax Assessment Total Assessment is a certain percentage of the fair market value that is determined by local assessors to be the total taxable value of land and additions on the property. | Land | Improvement |
|---|---|---|---|---|
| 2025 | $1,358 | $120,615 | $48,850 | $71,765 |
| 2024 | $1,323 | $118,251 | $47,893 | $70,358 |
| 2023 | $1,286 | $115,933 | $46,954 | $68,979 |
| 2022 | $1,265 | $113,661 | $46,034 | $67,627 |
| 2021 | $1,245 | $111,433 | $45,132 | $66,301 |
| 2020 | $1,219 | $110,292 | $44,670 | $65,622 |
| 2019 | $1,224 | $108,131 | $43,795 | $64,336 |
| 2018 | $1,142 | $106,012 | $42,937 | $63,075 |
| 2017 | $1,222 | $102,435 | $42,096 | $60,339 |
| 2016 | $1,083 | $100,427 | $41,271 | $59,156 |
| 2015 | $1,116 | $98,920 | $40,652 | $58,268 |
| 2014 | $1,106 | $96,983 | $39,856 | $57,127 |
Source: Public Records
Map
Nearby Homes
- 613 Ranee Ct
- 1235 N St
- 1363 Merganser Ct
- 1232 Woodduck Ct
- 507 Lady Slipper Ln
- 1336 Red Teal Dr
- 501 Flour Mill Dr
- 537 Bonanza Dr
- 1939 L St
- 941 Haycastle Ct
- 619-657 Inyo Ave
- 429 Red Lion Way
- 344 Red Lion Way
- 1118 Strawbridge Dr
- 662 Cedar Mountain Dr
- 407 Northampton Way
- 918 Castellona Dr
- 1441 Kern St
- 737 Orestimba Peak Dr
- 728 R St
- 1348 Eucalyptus Ave
- 1326 Eucalyptus Ave
- 1337 Clove Ct
- 1343 Clove Ct
- 1329 Clove Ct
- 1356 Eucalyptus Ave
- 1318 Eucalyptus Ave
- 1351 Clove Ct
- 1317 Clove Ct
- 1345 Eucalyptus Ave
- 1325 Eucalyptus Ave
- 1370 Eucalyptus Ave
- 1355 Eucalyptus Ave
- 1315 Eucalyptus Ave
- 1357 Clove Ct
- 1365 Eucalyptus Ave
- 428 Cinnamon Ln
- 1292 Eucalyptus Ave
- 1256 Amy Dr
- 1305 Eucalyptus Ave
Your Personal Tour Guide
Ask me questions while you tour the home.