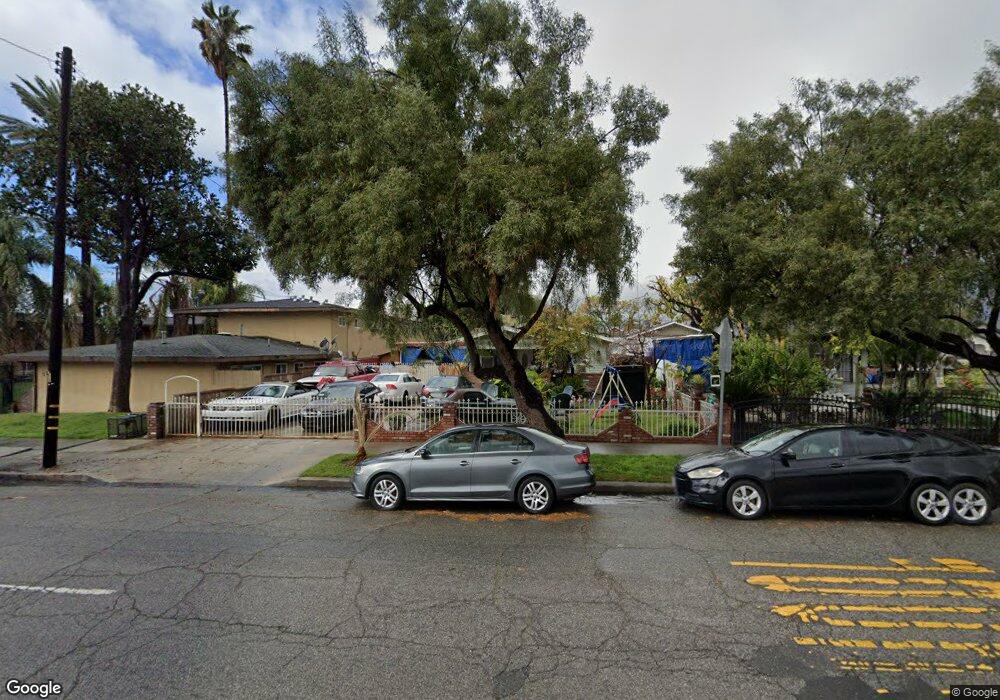
1338 N Arrowhead Ave San Bernardino, CA 92405
SBHS NeighborhoodEstimated Value: $355,000 - $453,655
3
Beds
2
Baths
1,497
Sq Ft
$283/Sq Ft
Est. Value
About This Home
This home is located at 1338 N Arrowhead Ave, San Bernardino, CA 92405 and is currently estimated at $424,164, approximately $283 per square foot. 1338 N Arrowhead Ave is a home located in San Bernardino County with nearby schools including Lincoln Elementary School, Arrowview Middle School, and San Bernardino High School.
Ownership History
Date
Name
Owned For
Owner Type
Purchase Details
Closed on
Jan 11, 2005
Sold by
Perez Jose David and Tovar Jose D
Bought by
Perez Jose David
Current Estimated Value
Home Financials for this Owner
Home Financials are based on the most recent Mortgage that was taken out on this home.
Original Mortgage
$105,000
Interest Rate
5.6%
Mortgage Type
New Conventional
Purchase Details
Closed on
May 1, 1998
Sold by
Hud
Bought by
Perez Jose David and Tovar Jose D
Home Financials for this Owner
Home Financials are based on the most recent Mortgage that was taken out on this home.
Original Mortgage
$54,550
Interest Rate
6.93%
Mortgage Type
FHA
Purchase Details
Closed on
Dec 17, 1997
Sold by
Norwest Mtg Inc
Bought by
Hud
Purchase Details
Closed on
Jul 10, 1997
Sold by
Norwest Mtg Inc
Bought by
Norwest Mtg Inc
Purchase Details
Closed on
Feb 23, 1994
Sold by
Green Shirley A
Bought by
Green Richard and Green Shirley A
Create a Home Valuation Report for This Property
The Home Valuation Report is an in-depth analysis detailing your home's value as well as a comparison with similar homes in the area
Home Values in the Area
Average Home Value in this Area
Purchase History
| Date | Buyer | Sale Price | Title Company |
|---|---|---|---|
| Perez Jose David | -- | United Title Los Angeles | |
| Perez Jose David | $55,000 | Commonwealth Land Title Co | |
| Hud | -- | First American Title Ins Co | |
| Norwest Mtg Inc | $85,655 | First American Title Ins Co | |
| Green Richard | -- | -- |
Source: Public Records
Mortgage History
| Date | Status | Borrower | Loan Amount |
|---|---|---|---|
| Closed | Perez Jose David | $105,000 | |
| Previous Owner | Perez Jose David | $54,550 |
Source: Public Records
Tax History Compared to Growth
Tax History
| Year | Tax Paid | Tax Assessment Tax Assessment Total Assessment is a certain percentage of the fair market value that is determined by local assessors to be the total taxable value of land and additions on the property. | Land | Improvement |
|---|---|---|---|---|
| 2025 | $1,717 | $133,258 | $23,513 | $109,745 |
| 2024 | $1,717 | $130,645 | $23,052 | $107,593 |
| 2023 | $1,672 | $128,083 | $22,600 | $105,483 |
| 2022 | $1,670 | $125,572 | $22,157 | $103,415 |
| 2021 | $1,668 | $123,110 | $21,723 | $101,387 |
| 2020 | $1,669 | $121,847 | $21,500 | $100,347 |
| 2019 | $1,620 | $119,457 | $21,078 | $98,379 |
| 2018 | $1,601 | $117,115 | $20,665 | $96,450 |
| 2017 | $1,550 | $114,819 | $20,260 | $94,559 |
| 2016 | $1,502 | $112,568 | $19,863 | $92,705 |
| 2015 | $1,378 | $110,877 | $19,565 | $91,312 |
| 2014 | $1,338 | $108,705 | $19,182 | $89,523 |
Source: Public Records
Map
Nearby Homes
- 381 W Wabash St
- 1305 N D St
- 1346 N D St
- 427 Magnolia Ave
- 1525 N Arrowhead Ave
- 464 W 14th St
- 156 W Wabash St
- 1550 N Pershing Ave
- 1372 N E St
- 1137 N Mayfield Ave
- 1330 Acacia Ave
- 1319 N Sierra Way
- 1305 N Sierra Way
- 1415 N Sierra Way
- 1572 N Stoddard Ave
- 1388 N Lugo Ave
- 425 W 17th St
- 1354 Sepulveda Ave
- 1479 N Lugo Ave
- 394 W 17th St
- 1340 N Arrowhead Ave
- 323 W Wabash St
- 333 W Wabash St
- 1352 N Arrowhead Ave
- 324 W Wabash St
- 341 W Wabash St
- 1354 N Arrowhead Ave
- 1300 N Arrowhead Ave
- 1347 N Arrowhead Ave
- 342 W 13th St
- 1349 N Arrowhead Ave
- 1345 N Arrowhead Ave
- 345 W Wabash St
- 1356 N Arrowhead Ave
- 348 W 13th St
- 340 W Wabash St
- 347 W Wabash St
- 1305 N Arrowhead Ave
- 349 W Wabash St
- 350 W 13th St