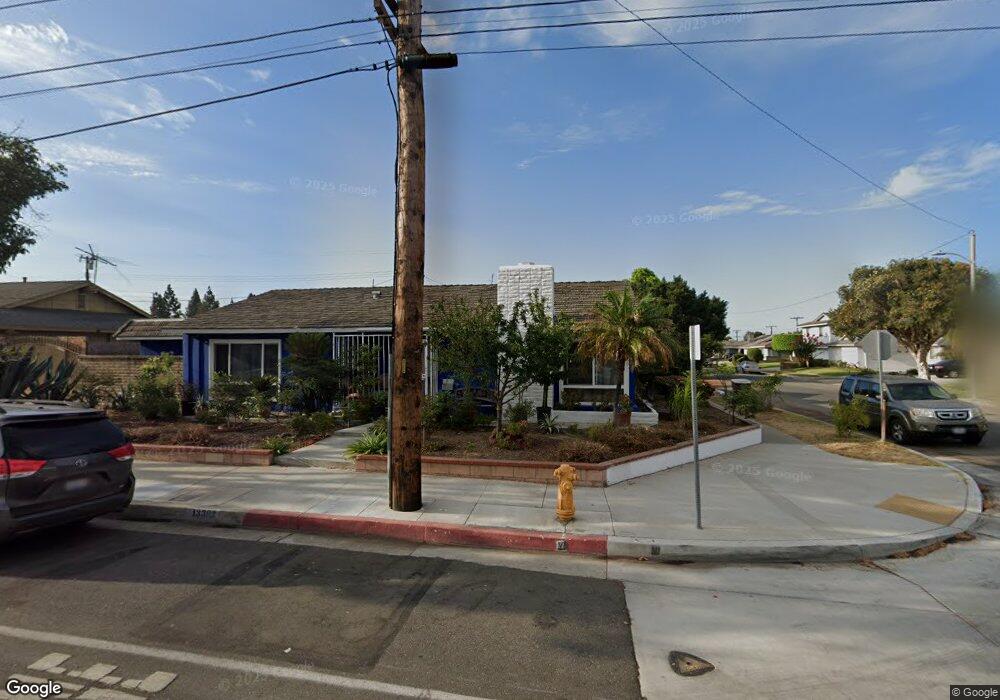
13382 Lampson Ave Garden Grove, CA 92840
Estimated Value: $999,000 - $1,266,000
3
Beds
2
Baths
2,023
Sq Ft
$548/Sq Ft
Est. Value
About This Home
This home is located at 13382 Lampson Ave, Garden Grove, CA 92840 and is currently estimated at $1,109,465, approximately $548 per square foot. 13382 Lampson Ave is a home located in Orange County with nearby schools including Lampson Elementary School, Portola Middle School, and Orange High School.
Ownership History
Date
Name
Owned For
Owner Type
Purchase Details
Closed on
Jul 20, 2020
Sold by
Vu Annie
Bought by
Nguyen Mai
Current Estimated Value
Purchase Details
Closed on
Mar 13, 2020
Sold by
Nguyen Mai
Bought by
Vu Annie
Purchase Details
Closed on
Oct 27, 2003
Sold by
Le Vinh Kien
Bought by
Nguyen Mai
Purchase Details
Closed on
Sep 10, 1997
Sold by
Nguyen Tinh
Bought by
Le Vinh Kien
Purchase Details
Closed on
Sep 13, 1995
Sold by
Clenenden Properties
Bought by
Nguyen Tinh
Home Financials for this Owner
Home Financials are based on the most recent Mortgage that was taken out on this home.
Original Mortgage
$125,000
Interest Rate
7.38%
Purchase Details
Closed on
Jul 6, 1995
Sold by
Beaumonte H Rolf
Bought by
Clendenen Properties
Create a Home Valuation Report for This Property
The Home Valuation Report is an in-depth analysis detailing your home's value as well as a comparison with similar homes in the area
Purchase History
| Date | Buyer | Sale Price | Title Company |
|---|---|---|---|
| Nguyen Mai | -- | None Available | |
| Vu Annie | -- | None Available | |
| Nguyen Mai | -- | Chicago Title Company | |
| Le Vinh Kien | -- | -- | |
| Nguyen Tinh | $157,000 | Fidelity National Title | |
| Clendenen Properties | $100,000 | -- |
Source: Public Records
Mortgage History
| Date | Status | Borrower | Loan Amount |
|---|---|---|---|
| Previous Owner | Nguyen Tinh | $125,000 |
Source: Public Records
Tax History
| Year | Tax Paid | Tax Assessment Tax Assessment Total Assessment is a certain percentage of the fair market value that is determined by local assessors to be the total taxable value of land and additions on the property. | Land | Improvement |
|---|---|---|---|---|
| 2025 | $7,676 | $649,458 | $527,321 | $122,137 |
| 2024 | $7,676 | $636,724 | $516,981 | $119,743 |
| 2023 | $7,509 | $624,240 | $506,844 | $117,396 |
| 2022 | $7,365 | $612,000 | $496,905 | $115,095 |
| 2021 | $7,165 | $600,000 | $487,161 | $112,839 |
| 2020 | $6,119 | $507,014 | $397,873 | $109,141 |
| 2019 | $6,041 | $497,073 | $390,072 | $107,001 |
| 2018 | $5,948 | $487,327 | $382,424 | $104,903 |
| 2017 | $5,713 | $477,772 | $374,925 | $102,847 |
| 2016 | $5,480 | $468,404 | $367,573 | $100,831 |
| 2015 | $5,399 | $461,369 | $362,052 | $99,317 |
| 2014 | $5,284 | $452,332 | $354,960 | $97,372 |
Source: Public Records
Map
Nearby Homes
- 12621 Spinnaker St
- 222 Lampson Ave
- 12560 Haster St
- 12560 Haster St Unit 207
- 13401 El Prado Ave
- 12925 Dahlia St
- 3702 W Park Central Ave
- 3607 W Park Central Ave Unit 2404
- 12812 Haster St
- 3440 W Park Balboa Ave
- 3518 W Park Central Ave
- 4512 W Sirius Ave
- 4524 W Sirius Ave
- 12241 Oertly Dr
- 2300 S Lewis St Unit 143
- 2300 S Lewis St Unit 66
- 12651 Citruswood Ave
- 2300 Lewis Stree St
- 951 E Twill Ct
- 12839 Sussex Cir
- 13392 Lampson Ave
- 13381 Laux Cir
- 13402 Lampson Ave
- 13391 Laux Cir
- 12511 Hilton St
- 12521 Hilton St
- 13401 Laux Cir
- 12531 Hilton St
- 13422 Lampson Ave
- 13421 Laux Cir
- 12541 Hilton St
- 12512 Spinnaker St
- 12522 Spinnaker St
- 13442 Lampson Ave
- 12532 Spinnaker St
- 13441 Laux Cir
- 12561 Hilton St
- 13382 Laux Cir
- 13392 Laux Cir
- 13402 Laux Cir
Your Personal Tour Guide
Ask me questions while you tour the home.