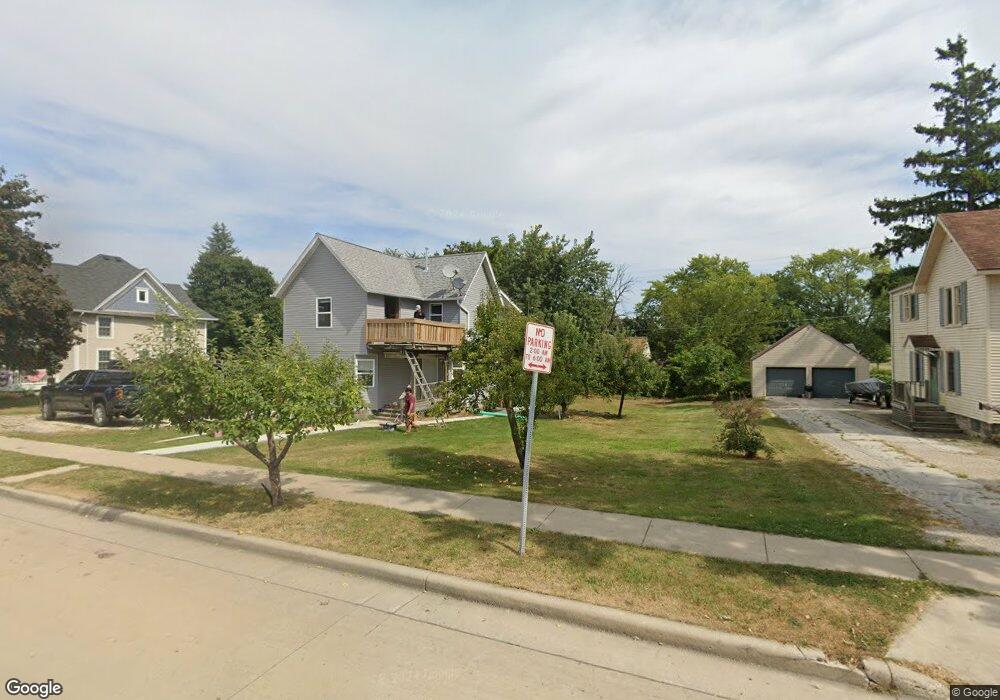
1339 Main St Union Grove, WI 53182
Estimated Value: $166,000 - $341,000
5
Beds
2
Baths
2,262
Sq Ft
$113/Sq Ft
Est. Value
About This Home
This home is located at 1339 Main St, Union Grove, WI 53182 and is currently estimated at $254,956, approximately $112 per square foot. 1339 Main St is a home located in Racine County with nearby schools including Union Grove Elementary School, Union Grove High School, and Union Grove Christian School.
Ownership History
Date
Name
Owned For
Owner Type
Purchase Details
Closed on
Jan 4, 2024
Sold by
Farley Leroy M
Bought by
1341 Main St Llc
Current Estimated Value
Home Financials for this Owner
Home Financials are based on the most recent Mortgage that was taken out on this home.
Original Mortgage
$116,375
Outstanding Balance
$114,204
Interest Rate
6.61%
Mortgage Type
Seller Take Back
Estimated Equity
$140,752
Create a Home Valuation Report for This Property
The Home Valuation Report is an in-depth analysis detailing your home's value as well as a comparison with similar homes in the area
Home Values in the Area
Average Home Value in this Area
Purchase History
| Date | Buyer | Sale Price | Title Company |
|---|---|---|---|
| 1341 Main St Llc | $122,500 | Victory Title Co Llc |
Source: Public Records
Mortgage History
| Date | Status | Borrower | Loan Amount |
|---|---|---|---|
| Open | 1341 Main St Llc | $116,375 |
Source: Public Records
Tax History Compared to Growth
Tax History
| Year | Tax Paid | Tax Assessment Tax Assessment Total Assessment is a certain percentage of the fair market value that is determined by local assessors to be the total taxable value of land and additions on the property. | Land | Improvement |
|---|---|---|---|---|
| 2024 | $2,756 | $178,100 | $47,800 | $130,300 |
| 2023 | $2,721 | $178,100 | $47,800 | $130,300 |
| 2022 | $2,869 | $178,100 | $47,800 | $130,300 |
| 2021 | $2,681 | $178,100 | $47,800 | $130,300 |
| 2020 | $3,499 | $179,800 | $36,000 | $143,800 |
| 2019 | $3,574 | $179,800 | $36,000 | $143,800 |
| 2018 | $3,457 | $180,900 | $36,000 | $144,900 |
| 2017 | $2,720 | $135,600 | $30,400 | $105,200 |
| 2016 | $2,716 | $135,600 | $30,400 | $105,200 |
| 2015 | $2,901 | $135,600 | $30,400 | $105,200 |
| 2014 | $2,851 | $135,600 | $30,400 | $105,200 |
| 2013 | $2,977 | $135,600 | $30,400 | $105,200 |
Source: Public Records
Map
Nearby Homes