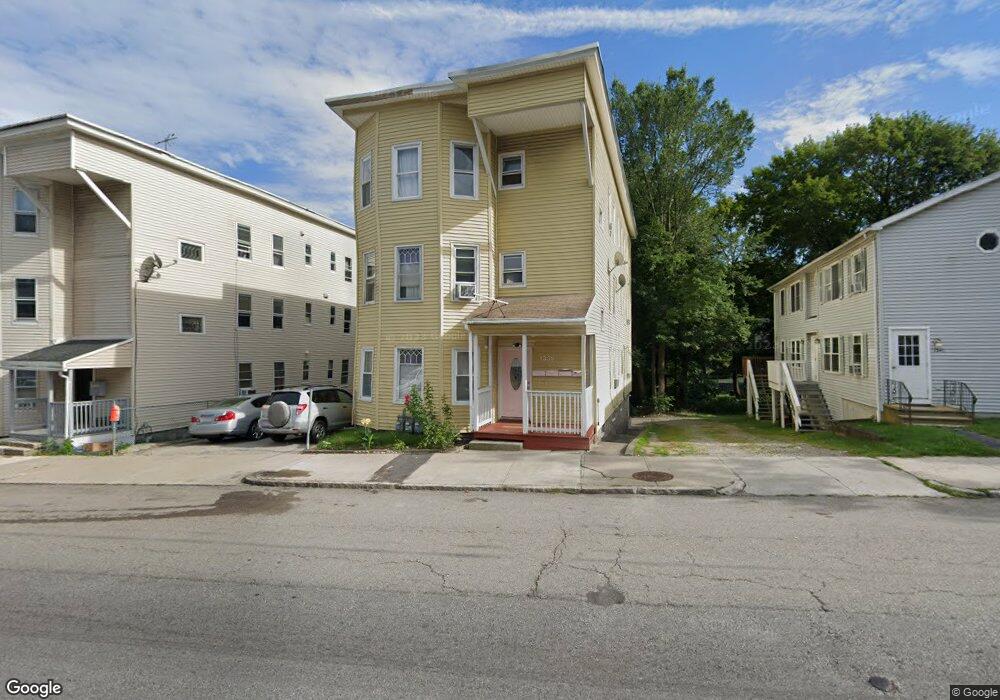
1339 Main St Unit 3 Worcester, MA 01603
Webster Square NeighborhoodEstimated Value: $743,000 - $839,000
3
Beds
1
Bath
1,350
Sq Ft
$577/Sq Ft
Est. Value
About This Home
This home is located at 1339 Main St Unit 3, Worcester, MA 01603 and is currently estimated at $778,409, approximately $576 per square foot. 1339 Main St Unit 3 is a home located in Worcester County with nearby schools including Gates Lane, Jacob Hiatt Magnet School, and Chandler Magnet.
Ownership History
Date
Name
Owned For
Owner Type
Purchase Details
Closed on
Jul 22, 2021
Sold by
Kissi-Ampomah George and Frimpong Monica N
Bought by
Asamany Wisdom and Yartey Stella
Current Estimated Value
Home Financials for this Owner
Home Financials are based on the most recent Mortgage that was taken out on this home.
Original Mortgage
$549,857
Outstanding Balance
$499,367
Interest Rate
2.96%
Mortgage Type
FHA
Estimated Equity
$279,042
Purchase Details
Closed on
Jan 21, 2021
Sold by
Ampomah George
Bought by
Ampomah George K and Frimpong Monica N
Home Financials for this Owner
Home Financials are based on the most recent Mortgage that was taken out on this home.
Original Mortgage
$297,500
Interest Rate
2.6%
Mortgage Type
Stand Alone Refi Refinance Of Original Loan
Purchase Details
Closed on
Jun 30, 2000
Sold by
Dube Kenneth R and Dube Donna F
Bought by
Ampomah George K and Frimpong Monica
Purchase Details
Closed on
Dec 18, 1996
Sold by
Mitchell Joan
Bought by
Dube Kennethr and Dube Donna F
Create a Home Valuation Report for This Property
The Home Valuation Report is an in-depth analysis detailing your home's value as well as a comparison with similar homes in the area
Home Values in the Area
Average Home Value in this Area
Purchase History
| Date | Buyer | Sale Price | Title Company |
|---|---|---|---|
| Asamany Wisdom | $560,000 | None Available | |
| Ampomah George K | -- | None Available | |
| Ampomah George K | $139,900 | -- | |
| Dube Kennethr | $83,500 | -- |
Source: Public Records
Mortgage History
| Date | Status | Borrower | Loan Amount |
|---|---|---|---|
| Open | Asamany Wisdom | $549,857 | |
| Previous Owner | Ampomah George K | $297,500 | |
| Previous Owner | Dube Kennethr | $192,500 | |
| Previous Owner | Dube Kennethr | $146,500 |
Source: Public Records
Tax History Compared to Growth
Tax History
| Year | Tax Paid | Tax Assessment Tax Assessment Total Assessment is a certain percentage of the fair market value that is determined by local assessors to be the total taxable value of land and additions on the property. | Land | Improvement |
|---|---|---|---|---|
| 2025 | $8,464 | $641,700 | $72,900 | $568,800 |
| 2024 | $7,758 | $564,200 | $72,900 | $491,300 |
| 2023 | $7,445 | $519,200 | $63,400 | $455,800 |
| 2022 | $6,478 | $425,900 | $50,800 | $375,100 |
| 2021 | $5,131 | $315,200 | $40,600 | $274,600 |
| 2020 | $4,194 | $246,700 | $40,300 | $206,400 |
| 2019 | $4,181 | $232,300 | $35,200 | $197,100 |
| 2018 | $4,079 | $215,700 | $35,200 | $180,500 |
| 2017 | $3,815 | $198,500 | $35,200 | $163,300 |
| 2016 | $3,654 | $177,300 | $25,800 | $151,500 |
| 2015 | $3,558 | $177,300 | $25,800 | $151,500 |
| 2014 | $3,464 | $177,300 | $25,800 | $151,500 |
Source: Public Records
Map
Nearby Homes
- 1339 Main St
- 1341 Main St Unit 1R
- 1341 Main St
- 1337 Main St
- 1337 Main St Unit 1
- 1337 Main St Unit 2
- 1337 Main St Unit 3
- 1347 Main St
- 8 Henshaw St
- 1335 Main St
- 12 Henshaw St
- 1332 Main St
- 1349 Main St
- 1 Eureka St
- 18 Henshaw St
- 9 Eureka St
- 11/13 Eureka St
- 4 Winchester Ave
- 11 Eureka St
- 11 Eureka St Unit 3