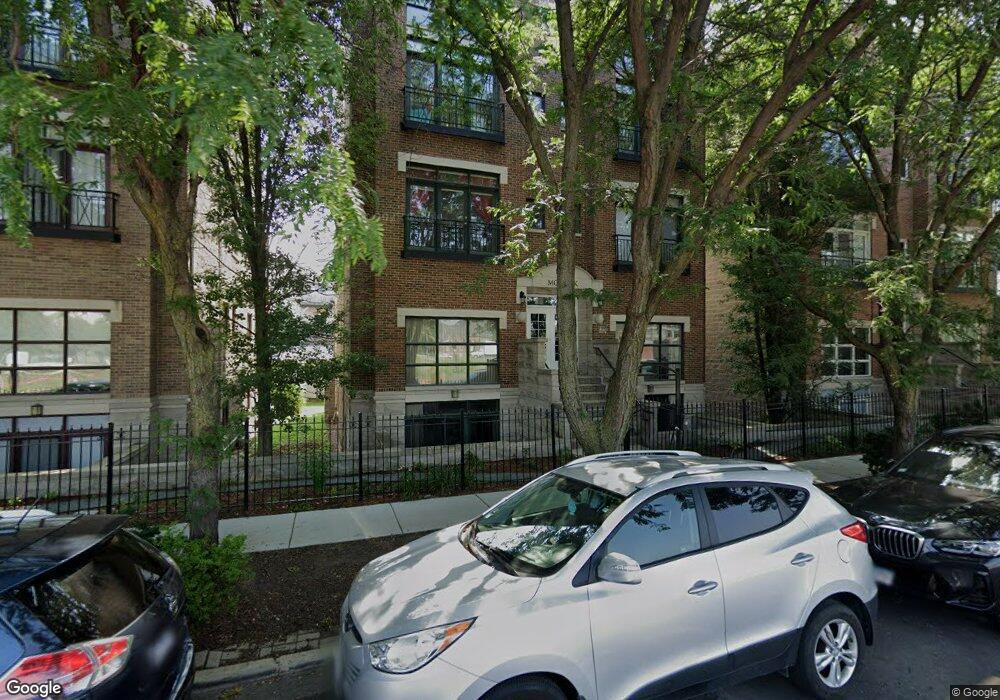
1339 N Mohawk St Unit 13393N Chicago, IL 60610
Old Town NeighborhoodEstimated Value: $721,000 - $823,000
3
Beds
--
Bath
2,200
Sq Ft
$344/Sq Ft
Est. Value
About This Home
This home is located at 1339 N Mohawk St Unit 13393N, Chicago, IL 60610 and is currently estimated at $756,879, approximately $344 per square foot. 1339 N Mohawk St Unit 13393N is a home located in Cook County with nearby schools including Manierre Elementary School, Lincoln Park High School, and The Noble Academy.
Ownership History
Date
Name
Owned For
Owner Type
Purchase Details
Closed on
Sep 11, 2005
Sold by
Schorr Andrew
Bought by
Mahlstedt Curtis L and Mahlstedt Craig L
Current Estimated Value
Home Financials for this Owner
Home Financials are based on the most recent Mortgage that was taken out on this home.
Original Mortgage
$310,000
Outstanding Balance
$167,411
Interest Rate
6%
Mortgage Type
Purchase Money Mortgage
Estimated Equity
$589,468
Purchase Details
Closed on
Jul 27, 2001
Sold by
Festoso Philip V and Festoso Anne Elise
Bought by
Schorr Andrew
Home Financials for this Owner
Home Financials are based on the most recent Mortgage that was taken out on this home.
Original Mortgage
$275,000
Interest Rate
6.87%
Purchase Details
Closed on
Mar 4, 1999
Sold by
American National Bk & Tr Co Of Chicago
Bought by
Festoso Philip V and Festoso Anne Elise
Create a Home Valuation Report for This Property
The Home Valuation Report is an in-depth analysis detailing your home's value as well as a comparison with similar homes in the area
Home Values in the Area
Average Home Value in this Area
Purchase History
| Date | Buyer | Sale Price | Title Company |
|---|---|---|---|
| Mahlstedt Curtis L | $565,000 | Rtc | |
| Schorr Andrew | $449,000 | -- | |
| Festoso Philip V | $359,000 | -- |
Source: Public Records
Mortgage History
| Date | Status | Borrower | Loan Amount |
|---|---|---|---|
| Open | Mahlstedt Curtis L | $310,000 | |
| Previous Owner | Schorr Andrew | $275,000 |
Source: Public Records
Tax History Compared to Growth
Tax History
| Year | Tax Paid | Tax Assessment Tax Assessment Total Assessment is a certain percentage of the fair market value that is determined by local assessors to be the total taxable value of land and additions on the property. | Land | Improvement |
|---|---|---|---|---|
| 2024 | $10,905 | $59,929 | $18,429 | $41,500 |
| 2023 | $10,609 | $55,000 | $14,862 | $40,138 |
| 2022 | $10,609 | $55,000 | $14,862 | $40,138 |
| 2021 | $10,390 | $54,999 | $14,862 | $40,137 |
| 2020 | $10,213 | $48,947 | $12,484 | $36,463 |
| 2019 | $10,024 | $53,321 | $12,484 | $40,837 |
| 2018 | $9,854 | $53,321 | $12,484 | $40,837 |
| 2017 | $9,072 | $45,518 | $10,106 | $35,412 |
| 2016 | $8,617 | $45,518 | $10,106 | $35,412 |
| 2015 | $7,860 | $45,518 | $10,106 | $35,412 |
| 2014 | $6,962 | $40,090 | $7,490 | $32,600 |
| 2013 | $6,813 | $40,090 | $7,490 | $32,600 |
Source: Public Records
Map
Nearby Homes
- 1329 N Mohawk St Unit 1
- 1310 N Cleveland Ave Unit 3
- 1428 N Mohawk St Unit A
- 1414 N Mohawk St
- 1317 N Larrabee St Unit 305
- 1317 N Larrabee St Unit 304
- 1503 N Mohawk St Unit 2E
- 334 W Goethe St Unit 14
- 511 W Division St Unit 607
- 1422 N Orleans St Unit 4S
- 1523 N Cleveland Ave Unit 2S
- 339 W Scott St
- 1444 N Orleans St Unit 6E
- 1444 N Orleans St Unit G39
- 1444 N Orleans St Unit G47
- 1444 N Orleans St Unit G45
- 1444 N Orleans St Unit G41
- 437 W Division St Unit 901
- 1245 N Orleans St Unit 903
- 1509 N Sedgwick St
- 1339 N Mohawk St Unit 1S
- 1339 N Mohawk St Unit 13391N
- 1339 N Mohawk St Unit 13392N
- 1339 N Mohawk St Unit 13392S
- 1339 N Mohawk St Unit 13391S
- 1339 N Mohawk St Unit 13393S
- 1339 N Mohawk St Unit 2S
- 1339 N Mohawk St Unit 3N
- 1339 N Mohawk St Unit 3S
- 1339 N Mohawk St Unit 1N
- 1335 N Mohawk St Unit 2N
- 1335 N Mohawk St Unit 13352S
- 1335 N Mohawk St Unit 13353S
- 1335 N Mohawk St Unit 13352N
- 1335 N Mohawk St Unit 13351S
- 1335 N Mohawk St Unit 13353N
- 1335 N Mohawk St Unit 13351N
- 1335 N Mohawk St Unit 3N
- 1335 N Mohawk St Unit 1N
- 1335 N Mohawk St Unit 3S