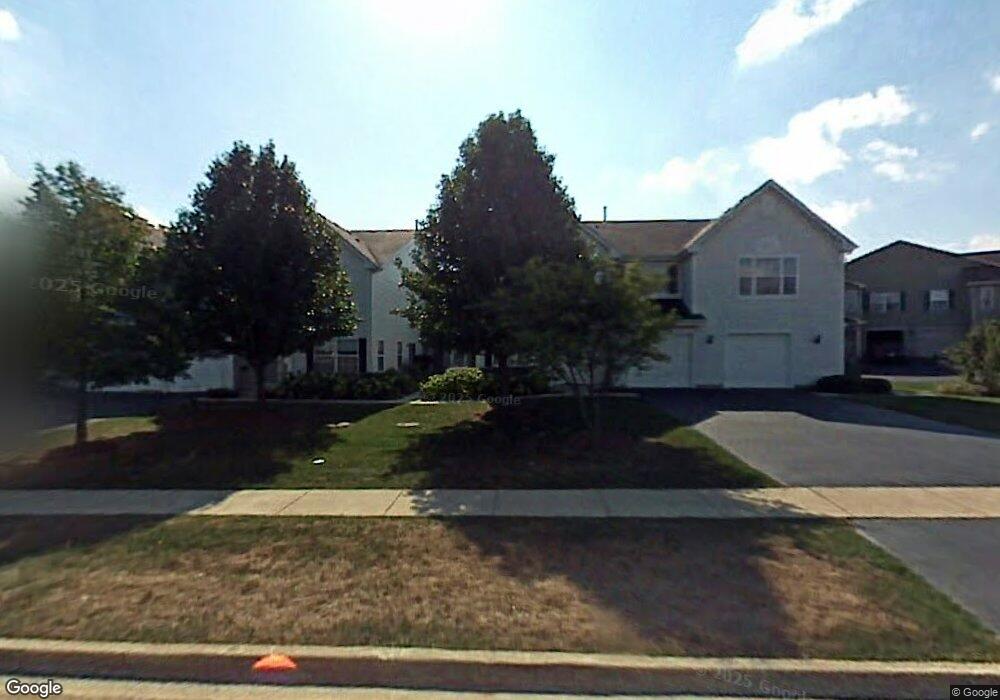
1339 Orleans Dr Unit 1339 Mundelein, IL 60060
Estimated Value: $269,209 - $285,000
2
Beds
3
Baths
1,150
Sq Ft
$241/Sq Ft
Est. Value
About This Home
This home is located at 1339 Orleans Dr Unit 1339, Mundelein, IL 60060 and is currently estimated at $277,302, approximately $241 per square foot. 1339 Orleans Dr Unit 1339 is a home located in Lake County with nearby schools including Hawthorn School Of Dual Language, Hawthorn Elementary School South, and Hawthorn Middle School South.
Ownership History
Date
Name
Owned For
Owner Type
Purchase Details
Closed on
Aug 27, 2003
Sold by
Guretz David A
Bought by
Kato Misayo
Current Estimated Value
Home Financials for this Owner
Home Financials are based on the most recent Mortgage that was taken out on this home.
Original Mortgage
$143,250
Outstanding Balance
$67,321
Interest Rate
6.43%
Mortgage Type
Unknown
Estimated Equity
$209,981
Purchase Details
Closed on
May 27, 1999
Sold by
Schulman Cathy
Bought by
Guretz David A
Home Financials for this Owner
Home Financials are based on the most recent Mortgage that was taken out on this home.
Original Mortgage
$130,150
Interest Rate
6.92%
Mortgage Type
FHA
Purchase Details
Closed on
Nov 15, 1994
Sold by
Lakewood Village Ltd Partnership
Bought by
Schulman Cathy
Home Financials for this Owner
Home Financials are based on the most recent Mortgage that was taken out on this home.
Original Mortgage
$99,600
Interest Rate
8.75%
Create a Home Valuation Report for This Property
The Home Valuation Report is an in-depth analysis detailing your home's value as well as a comparison with similar homes in the area
Home Values in the Area
Average Home Value in this Area
Purchase History
| Date | Buyer | Sale Price | Title Company |
|---|---|---|---|
| Kato Misayo | $191,000 | Chicago Title Insurance Comp | |
| Guretz David A | $137,000 | -- | |
| Schulman Cathy | $125,000 | Chicago Title Insurance Co |
Source: Public Records
Mortgage History
| Date | Status | Borrower | Loan Amount |
|---|---|---|---|
| Open | Kato Misayo | $143,250 | |
| Previous Owner | Guretz David A | $130,150 | |
| Previous Owner | Schulman Cathy | $99,600 |
Source: Public Records
Tax History Compared to Growth
Tax History
| Year | Tax Paid | Tax Assessment Tax Assessment Total Assessment is a certain percentage of the fair market value that is determined by local assessors to be the total taxable value of land and additions on the property. | Land | Improvement |
|---|---|---|---|---|
| 2024 | $5,140 | $68,786 | $23,387 | $45,399 |
| 2023 | $5,008 | $60,096 | $20,432 | $39,664 |
| 2022 | $5,008 | $56,475 | $19,201 | $37,274 |
| 2021 | $4,882 | $55,866 | $18,994 | $36,872 |
| 2020 | $4,900 | $56,057 | $19,059 | $36,998 |
| 2019 | $4,857 | $55,851 | $18,989 | $36,862 |
| 2018 | $3,918 | $46,177 | $18,429 | $27,748 |
| 2017 | $3,877 | $45,099 | $17,999 | $27,100 |
| 2016 | $3,749 | $43,185 | $17,235 | $25,950 |
| 2015 | $3,616 | $40,386 | $16,118 | $24,268 |
| 2014 | $4,986 | $54,078 | $17,310 | $36,768 |
| 2012 | $4,921 | $54,187 | $17,345 | $36,842 |
Source: Public Records
Map
Nearby Homes
- 1303 Orleans Dr Unit 1303
- 1220 Orleans Dr Unit 1220
- 668 Portage Ct Unit 345
- 349 W Pointe Dr
- 305 N Fiore Pkwy
- 872 Lansing Ct Unit 151
- 911 Ann Arbor Ln Unit 253
- 902 Sparta Ct Unit 92
- 571 Grosse Pointe Cir Unit 117
- 580 Muskegan Ct Unit 401
- 602 Muskegan Ct Unit 387
- 414 Briarwood Ct Unit 1D
- 291 Hunter Ct
- 234 Us Highway 45
- 233 Harvest Ct
- 307 Albright Ct
- 585 Yosemite Way
- 336 Westwood Ct Unit 42D
- 579 Yosemite Way
- 577 Yosemite Way
- 1347 Orleans Dr Unit 1347
- 1345 Orleans Dr Unit 1345
- 1343 Orleans Dr Unit 1343
- 1341 Orleans Dr Unit 1341
- 1337 Orleans Dr Unit 1337
- 1335 Orleans Dr Unit 1335
- 1333 Orleans Dr Unit 1333
- 1329 Orleans Dr Unit 1329
- 1329 Orleans Dr
- 1331 Orleans Dr Unit 1331
- 1327 Orleans Dr Unit 1327
- 1323 Orleans Dr Unit 1323
- 1321 Orleans Dr Unit 1321
- 1319 Orleans Dr Unit 1319
- 1317 Orleans Dr Unit 1317
- 1325 Orleans Dr
- 1363 Orleans Dr Unit 1363
- 1361 Orleans Dr Unit 1361
- 1359 Orleans Dr Unit 1359
- 1357 Orleans Dr Unit 1357