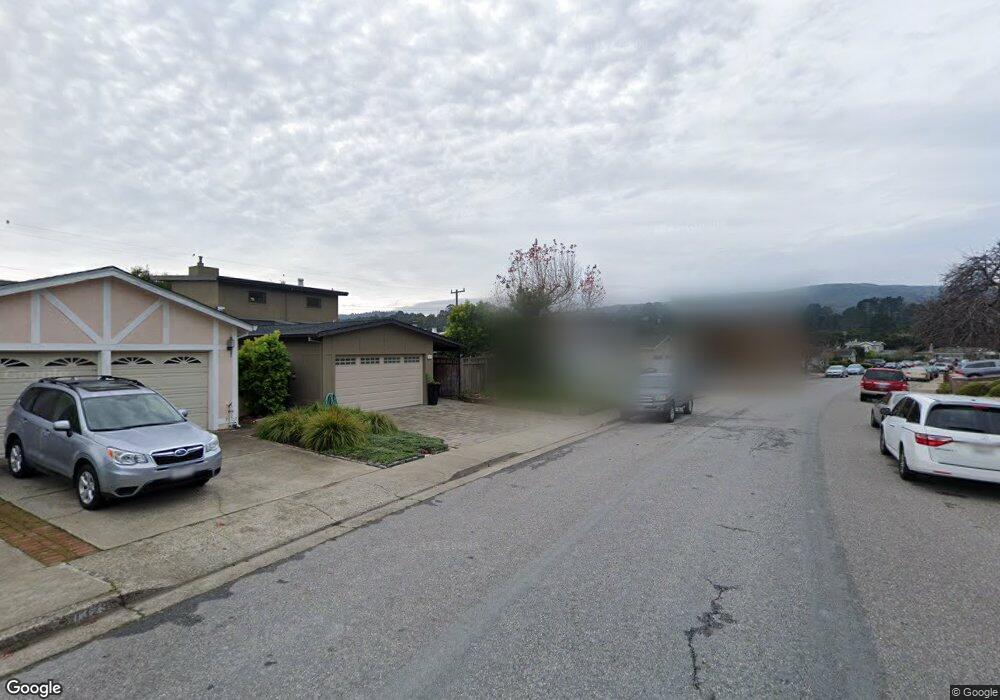
1339 Ridgewood Dr Millbrae, CA 94030
Millbrae Meadows NeighborhoodEstimated Value: $1,870,035 - $2,119,000
3
Beds
2
Baths
1,530
Sq Ft
$1,292/Sq Ft
Est. Value
About This Home
This home is located at 1339 Ridgewood Dr, Millbrae, CA 94030 and is currently estimated at $1,976,509, approximately $1,291 per square foot. 1339 Ridgewood Dr is a home located in San Mateo County with nearby schools including Meadows Elementary School, Taylor Middle School, and Mills High School.
Ownership History
Date
Name
Owned For
Owner Type
Purchase Details
Closed on
Jan 19, 2021
Sold by
Tsang Frank Chiu Ng and Tsang Judy Ming
Bought by
Tsang Hin Fan
Current Estimated Value
Purchase Details
Closed on
May 5, 2003
Sold by
Tsang Frank and Tsang Judy Ming Ming Sze
Bought by
Tsang Frank Chiu Ng and Tsang Judy Ming Ming Sze
Purchase Details
Closed on
Aug 8, 2002
Sold by
Chan Julia Liu
Bought by
Tsang Hin F and Tsang Frank
Home Financials for this Owner
Home Financials are based on the most recent Mortgage that was taken out on this home.
Original Mortgage
$300,000
Interest Rate
5.96%
Purchase Details
Closed on
May 30, 1997
Sold by
Grech Anthony J and Grech Adrienne J
Bought by
Chan Julia Liu
Home Financials for this Owner
Home Financials are based on the most recent Mortgage that was taken out on this home.
Original Mortgage
$270,000
Interest Rate
7.98%
Mortgage Type
Stand Alone First
Create a Home Valuation Report for This Property
The Home Valuation Report is an in-depth analysis detailing your home's value as well as a comparison with similar homes in the area
Home Values in the Area
Average Home Value in this Area
Purchase History
| Date | Buyer | Sale Price | Title Company |
|---|---|---|---|
| Tsang Hin Fan | -- | None Available | |
| Tsang Frank Chiu Ng | -- | None Available | |
| Tsang Hin F | $650,000 | Chicago Title Insurance Comp | |
| Chan Julia Liu | $459,000 | Old Republic Title Ins Compa |
Source: Public Records
Mortgage History
| Date | Status | Borrower | Loan Amount |
|---|---|---|---|
| Closed | Tsang Hin F | $300,000 | |
| Previous Owner | Chan Julia Liu | $270,000 |
Source: Public Records
Tax History
| Year | Tax Paid | Tax Assessment Tax Assessment Total Assessment is a certain percentage of the fair market value that is determined by local assessors to be the total taxable value of land and additions on the property. | Land | Improvement |
|---|---|---|---|---|
| 2025 | $16,989 | $1,399,479 | $879,387 | $520,092 |
| 2023 | $16,989 | $1,321,140 | $845,241 | $475,899 |
| 2022 | $14,719 | $1,295,236 | $828,668 | $466,568 |
| 2021 | $10,068 | $869,706 | $434,853 | $434,853 |
| 2020 | $9,905 | $860,790 | $430,395 | $430,395 |
| 2019 | $9,673 | $843,912 | $421,956 | $421,956 |
| 2018 | $9,484 | $827,366 | $413,683 | $413,683 |
| 2017 | $9,250 | $811,144 | $405,572 | $405,572 |
| 2016 | $9,129 | $795,240 | $397,620 | $397,620 |
| 2015 | $9,067 | $783,296 | $391,648 | $391,648 |
| 2014 | $8,862 | $767,954 | $383,977 | $383,977 |
Source: Public Records
Map
Nearby Homes
- 1116 Glenwood Dr
- 1027 Crestview Dr
- 910 Helen Dr
- 508 Juanita Ave
- 520 Park Blvd
- 408 Cypress Ave
- 468 Cedar Ave
- 531 Anita Ln
- 842 Clearfield Dr
- 183 Poplar Ave
- 466 Oak Ave
- 2981 Crestmoor Dr
- 273 Poplar Ave
- 5202 Shelter Creek Ln
- 8124 Shelter Creek Ln
- 4222 Shelter Creek Ln Unit 4222
- 2316 Shelter Creek Ln Unit 2316
- 4359 Shelter Creek Ln Unit 4359
- 2150 Shelter Creek Ln Unit 2150
- 1332 Shelter Creek Ln
- 1335 Ridgewood Dr
- 1345 Ridgewood Dr
- 860 Robin Ln
- 856 Robin Ln
- 866 Robin Ln
- 1329 Ridgewood Dr
- 1349 Ridgewood Dr
- 850 Robin Ln
- 870 Robin Ln
- 1336 Ridgewood Dr
- 1340 Ridgewood Dr
- 1325 Ridgewood Dr
- 1355 Ridgewood Dr
- 846 Robin Ln
- 1346 Ridgewood Dr
- 876 Robin Ln
- 1326 Ridgewood Dr
- 1319 Ridgewood Dr
- 840 Robin Ln
Your Personal Tour Guide
Ask me questions while you tour the home.