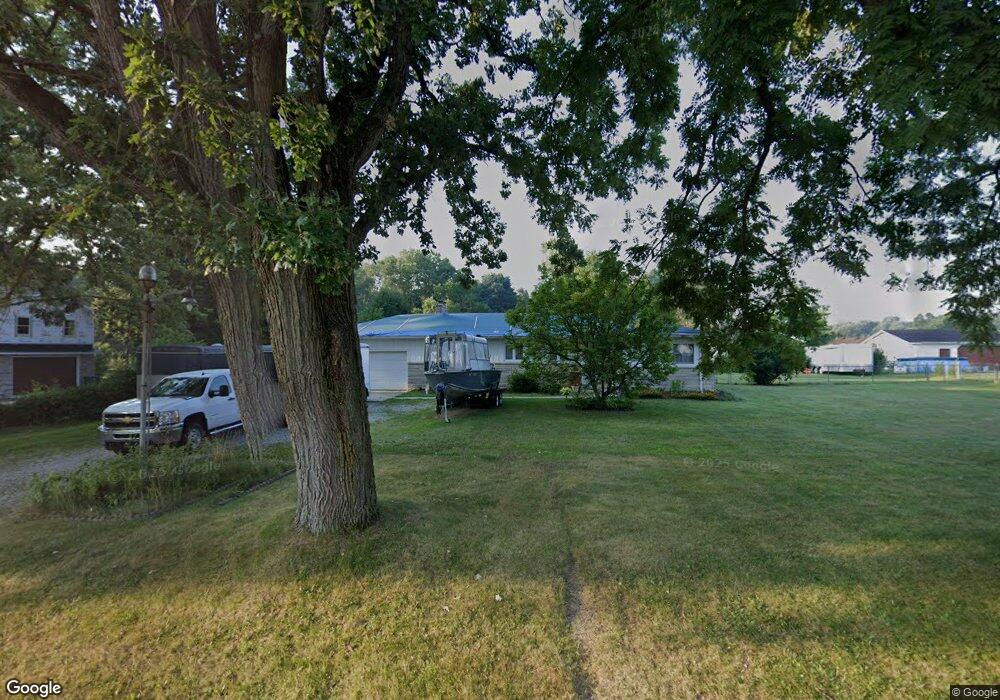
13394 Adams Rd Granger, IN 46530
Estimated Value: $281,000 - $333,517
2
Beds
2
Baths
1,253
Sq Ft
$239/Sq Ft
Est. Value
About This Home
This home is located at 13394 Adams Rd, Granger, IN 46530 and is currently estimated at $299,879, approximately $239 per square foot. 13394 Adams Rd is a home located in St. Joseph County with nearby schools including Mary Frank Harris Elementary School, Discovery Middle School, and Penn High School.
Ownership History
Date
Name
Owned For
Owner Type
Purchase Details
Closed on
Dec 19, 2023
Sold by
Klatt Jason M
Bought by
Klatt Stephen E and Klatt Jason M
Current Estimated Value
Purchase Details
Closed on
Dec 15, 2023
Sold by
Klatt Jason M
Bought by
Klatt Stephen E and Klatt Jason M
Purchase Details
Closed on
May 16, 2018
Sold by
Patrick Palmer
Bought by
Klatt Stephen E and Klatt Jason M
Home Financials for this Owner
Home Financials are based on the most recent Mortgage that was taken out on this home.
Original Mortgage
$169,000
Interest Rate
4.4%
Mortgage Type
Credit Line Revolving
Purchase Details
Closed on
Mar 30, 2016
Sold by
Palmer Norma J
Bought by
Palmer Patrick
Create a Home Valuation Report for This Property
The Home Valuation Report is an in-depth analysis detailing your home's value as well as a comparison with similar homes in the area
Home Values in the Area
Average Home Value in this Area
Purchase History
| Date | Buyer | Sale Price | Title Company |
|---|---|---|---|
| Klatt Stephen E | -- | None Listed On Document | |
| Klatt Stephen E | -- | None Listed On Document | |
| Klatt Stephen E | $224,770 | Fidelity National Title | |
| Palmer Patrick | -- | -- |
Source: Public Records
Mortgage History
| Date | Status | Borrower | Loan Amount |
|---|---|---|---|
| Previous Owner | Klatt Stephen E | $169,000 |
Source: Public Records
Tax History
| Year | Tax Paid | Tax Assessment Tax Assessment Total Assessment is a certain percentage of the fair market value that is determined by local assessors to be the total taxable value of land and additions on the property. | Land | Improvement |
|---|---|---|---|---|
| 2025 | $2,317 | $290,600 | $78,800 | $211,800 |
| 2024 | $2,317 | $256,600 | $78,800 | $177,800 |
| 2023 | $2,196 | $233,100 | $78,800 | $154,300 |
| 2022 | $2,196 | $233,100 | $78,800 | $154,300 |
| 2021 | $2,060 | $203,900 | $63,600 | $140,300 |
| 2020 | $1,832 | $188,800 | $59,300 | $129,500 |
| 2019 | $1,655 | $173,400 | $54,200 | $119,200 |
| 2018 | $1,516 | $163,100 | $49,500 | $113,600 |
| 2017 | $3,194 | $160,300 | $49,500 | $110,800 |
| 2016 | $1,319 | $160,300 | $49,500 | $110,800 |
| 2014 | $896 | $125,900 | $39,300 | $86,600 |
Source: Public Records
Map
Nearby Homes
- 13206 Adams Rd
- 51098 Cherry Rd
- 51772 Currant Rd
- 51405 Elm Rd
- 51272 Bittersweet Rd
- 14030 Kline Shores Lot 29 Dr Unit 29
- 50558 Hollybrook Dr
- 15731 Indiana 23
- 12338 Ashland St
- 13733 Brick Rd
- 14170 Kline Shores Lot 23 Dr Unit 23
- 12983 Brick Rd
- 14413 Worthington Dr
- 51815 Bittersweet Rd
- 52070 Olympus Pass
- 51216 Leeward Point
- 51727 Salem Meadows Lot 15 Dr Unit 15
- 51633 Bitterly Ct
- 12793 Brick Rd Unit Lot 4
- 52118 Olympus Pass
- 13568 Adams Rd
- 13376 Adams Rd
- 13370 Kingsfield Ct
- 13350 Kingsfield Ct
- 13390 Kingsfield Ct
- 13370 Adams Rd
- 13576 Adams Rd
- 50980 Cherry Farm Trail
- 13410 Kingsfield Ct
- 13362 Adams Rd
- 50962 Cherry Farm Trail
- 13353 Kingsfield Ct
- 13393 Kingsfield Ct
- 13425 Kingsfield Ct
- 13588 Adams Rd
- 13411 Kingsfield Ct
- 50980 Sturdy Oak Ln
- 50940 Cherry Farm Trail
- 13340 Adams Rd
- 50915 Cherry Farm Trail
Your Personal Tour Guide
Ask me questions while you tour the home.