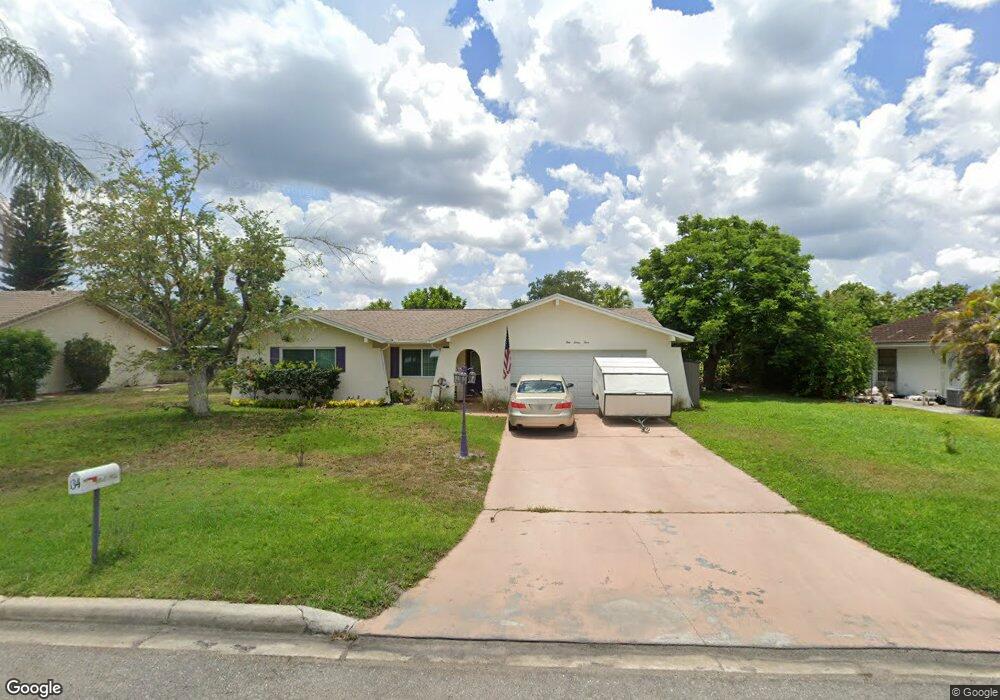
134 Brookside St Lehigh Acres, FL 33936
Eisenhower NeighborhoodEstimated Value: $223,000 - $254,000
2
Beds
2
Baths
1,650
Sq Ft
$145/Sq Ft
Est. Value
About This Home
This home is located at 134 Brookside St, Lehigh Acres, FL 33936 and is currently estimated at $239,845, approximately $145 per square foot. 134 Brookside St is a home located in Lee County with nearby schools including Lehigh Elementary School, The Alva School, and Gateway Elementary School.
Ownership History
Date
Name
Owned For
Owner Type
Purchase Details
Closed on
Aug 9, 2012
Sold by
The Bank Of New York Mellon
Bought by
Parker Dennis and Parker Maura M
Current Estimated Value
Purchase Details
Closed on
Apr 13, 2012
Sold by
Coleman April R
Bought by
The Bank Of New York Mellon and The Bank Of New York
Purchase Details
Closed on
Sep 3, 2004
Sold by
Mouser Dennis and Mouser Heather
Bought by
Coleman April R
Home Financials for this Owner
Home Financials are based on the most recent Mortgage that was taken out on this home.
Original Mortgage
$105,315
Interest Rate
7.8%
Mortgage Type
Unknown
Purchase Details
Closed on
Jun 28, 2000
Sold by
Hennessey Lorraine
Bought by
Mouser Dennis D and Mouser Heather P
Home Financials for this Owner
Home Financials are based on the most recent Mortgage that was taken out on this home.
Original Mortgage
$67,510
Interest Rate
8.63%
Mortgage Type
FHA
Create a Home Valuation Report for This Property
The Home Valuation Report is an in-depth analysis detailing your home's value as well as a comparison with similar homes in the area
Home Values in the Area
Average Home Value in this Area
Purchase History
| Date | Buyer | Sale Price | Title Company |
|---|---|---|---|
| Parker Dennis | $47,800 | North American Title Company | |
| The Bank Of New York Mellon | $162,400 | Attorney | |
| Coleman April R | $123,900 | Tri County Title Insurance A | |
| Mouser Dennis D | $67,600 | -- |
Source: Public Records
Mortgage History
| Date | Status | Borrower | Loan Amount |
|---|---|---|---|
| Previous Owner | Coleman April R | $105,315 | |
| Previous Owner | Mouser Dennis D | $67,510 |
Source: Public Records
Tax History
| Year | Tax Paid | Tax Assessment Tax Assessment Total Assessment is a certain percentage of the fair market value that is determined by local assessors to be the total taxable value of land and additions on the property. | Land | Improvement |
|---|---|---|---|---|
| 2025 | $2,648 | $199,212 | $22,715 | $176,497 |
| 2024 | $2,522 | $196,014 | -- | -- |
Source: Public Records
Map
Nearby Homes
- 514 Pennview Ave
- 14 Richmond Ave N
- 26 Michigan Rd
- 406 Leeland Heights Blvd E
- 1217 Clayton Ave
- 1604 Clayton Ave
- 12 Calvin Ave
- 15 Maryland Rd
- 112 Clayton Ave
- 110 Texas Rd
- 108 Coolidge Ave
- 21 Maryland Rd
- 18 Illinois Rd
- 213 Richmond Ave S
- 32 Lincoln Ave
- 56 Illinois Rd
- 19 Illinois Rd
- 219 Richmond Ave S
- 117 Coolidge Ave
- 3906 Leeland Heights Blvd E
- 136 Brookside St
- 132 Brookside St
- 123 Oakside St
- 125 Oakside St
- 133 Brookside St Unit 1
- 135 Brookside St
- 138 Brookside St
- 130 Brookside St
- 127 Oakside St
- 131 Brookside St
- 137 Brookside St
- 105 Airview Ave
- 121 Oakside St
- 238 Brookside St
- 139 Brookside St
- 124 Oakside St
- 129 Brookside St
- 225 Oakside St
- 126 Oakside St
- 107 Airview St
Your Personal Tour Guide
Ask me questions while you tour the home.