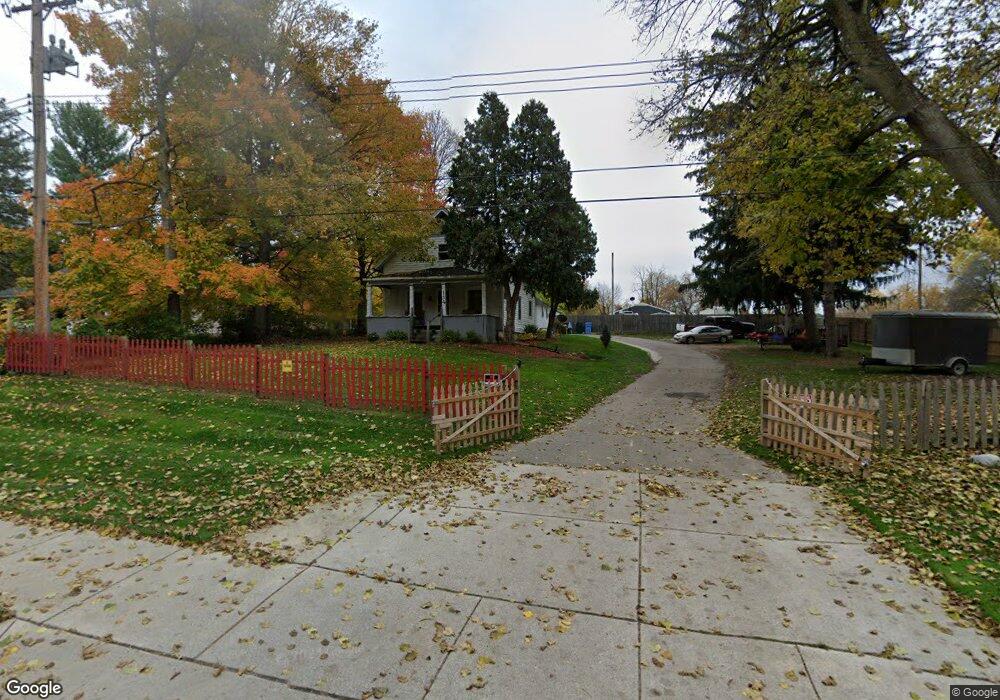
134 E Northrup St Lansing, MI 48911
Southern Lansing NeighborhoodEstimated Value: $206,000 - $265,000
--
Bed
2
Baths
1,104
Sq Ft
$218/Sq Ft
Est. Value
About This Home
This home is located at 134 E Northrup St, Lansing, MI 48911 and is currently estimated at $240,439, approximately $217 per square foot. 134 E Northrup St is a home located in Ingham County with nearby schools including Kendon School, Attwood School, and Everett High School.
Ownership History
Date
Name
Owned For
Owner Type
Purchase Details
Closed on
Jun 25, 2015
Sold by
Wells Fargo Bank Na
Bought by
Salgado Lopez Golria E
Current Estimated Value
Purchase Details
Closed on
Jun 5, 2014
Sold by
Wells Fargo Bank Na
Bought by
Green Tree Servicing Llc
Purchase Details
Closed on
Feb 22, 2005
Sold by
Robbins Calvan L and Robbins Renee A
Bought by
Robbins Calvan L and Robbins Renee A
Purchase Details
Closed on
Dec 19, 1997
Sold by
Laskowsky Catherine N
Bought by
Robbins Calvin L
Create a Home Valuation Report for This Property
The Home Valuation Report is an in-depth analysis detailing your home's value as well as a comparison with similar homes in the area
Home Values in the Area
Average Home Value in this Area
Purchase History
| Date | Buyer | Sale Price | Title Company |
|---|---|---|---|
| Salgado Lopez Golria E | $32,000 | None Available | |
| Green Tree Servicing Llc | $52,360 | None Available | |
| Robbins Calvan L | -- | -- | |
| Robbins Calvin L | $83,000 | -- |
Source: Public Records
Tax History
| Year | Tax Paid | Tax Assessment Tax Assessment Total Assessment is a certain percentage of the fair market value that is determined by local assessors to be the total taxable value of land and additions on the property. | Land | Improvement |
|---|---|---|---|---|
| 2025 | $6,115 | $138,700 | $18,800 | $119,900 |
| 2024 | $50 | $116,700 | $18,800 | $97,900 |
| 2023 | $5,744 | $105,500 | $18,800 | $86,700 |
| 2022 | $4,020 | $76,800 | $17,300 | $59,500 |
| 2021 | $3,932 | $68,200 | $11,800 | $56,400 |
| 2020 | $3,675 | $61,100 | $11,800 | $49,300 |
| 2019 | $3,533 | $55,500 | $11,800 | $43,700 |
| 2018 | $3,332 | $52,600 | $11,800 | $40,800 |
| 2017 | $3,269 | $52,600 | $11,800 | $40,800 |
| 2016 | $5,189 | $49,100 | $11,800 | $37,300 |
| 2015 | $5,189 | $47,600 | $23,566 | $24,034 |
| 2014 | $5,189 | $46,500 | $27,997 | $18,503 |
Source: Public Records
Map
Nearby Homes
- 208 E Northrup St
- 115 E Claremore Dr
- 5267 Crocus Ave
- 205 E Jolly Rd Unit 6
- 419 W Jolly Rd
- 5009 Kessler Dr
- 5008 Southgate Ave
- 201 E Syringa Dr
- 6246 Gardenia Ave
- 826 R G Curtiss Ave
- 1115 Shirley St
- 111 E Potter Ave
- 221 W Everettdale Ave
- 1109 Barr Ave
- 4926 Burchfield Ave
- 1015 Brad St
- 6429 Rosedale Rd
- 4907 Burchfield Ave
- 1020 R G Curtiss Ave
- 6444 Sommerset Rd
- 122 E Northrup St
- 304 E Northrup St
- 221 E Northrup St
- 201 E Northrup St
- 116 E Northrup St
- 132 E Northrup St Unit (132
- 132 E Northrup St
- 125 E Northrup St
- 301 E Northrup St
- 228 Trinity Cir
- 108 E Northrup St
- 315 E Northrup St
- 115 E Northrup St
- 234 Trinity Cir
- 226 Trinity Cir
- 5527 Mccourt St
- 308 Redner St
- 326 E Northrup St
- 5521 Mccourt St
Your Personal Tour Guide
Ask me questions while you tour the home.