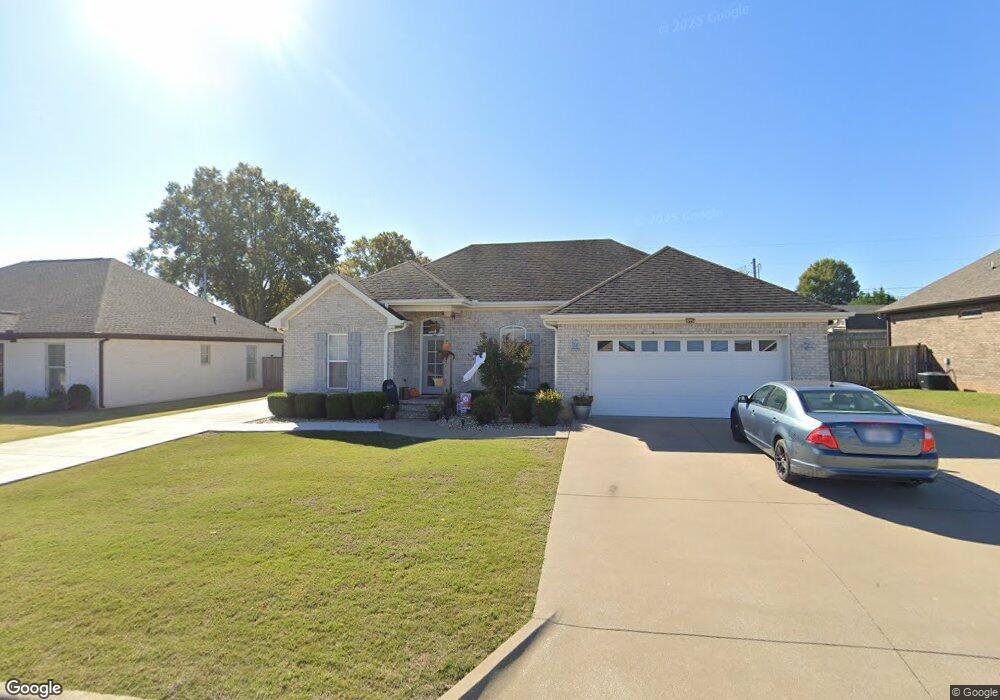
134 Fox Loop Muscle Shoals, AL 35661
Estimated Value: $250,918 - $280,000
3
Beds
--
Bath
1,325
Sq Ft
$201/Sq Ft
Est. Value
About This Home
This home is located at 134 Fox Loop, Muscle Shoals, AL 35661 and is currently estimated at $266,480, approximately $201 per square foot. 134 Fox Loop is a home located in Colbert County with nearby schools including Highland Park Elementary School, McBride Elementary School, and Muscle Shoals Middle School.
Ownership History
Date
Name
Owned For
Owner Type
Purchase Details
Closed on
Apr 22, 2016
Sold by
Hall Ronnie J and Hall Terri A
Bought by
Hall Ronnie J and Hall Terri A
Current Estimated Value
Purchase Details
Closed on
Dec 12, 2014
Sold by
Landmark Properties Llc and Coons William J
Bought by
Hall Ronnie J and Coons Vera F
Home Financials for this Owner
Home Financials are based on the most recent Mortgage that was taken out on this home.
Original Mortgage
$140,409
Interest Rate
3.75%
Mortgage Type
FHA
Purchase Details
Closed on
May 28, 2014
Sold by
Craft Jerry R and Craft Dale L
Bought by
Landmark Properties Llc
Purchase Details
Closed on
May 7, 2009
Sold by
Obryant James A
Bought by
Craft Jerry R and Craft Dale L
Home Financials for this Owner
Home Financials are based on the most recent Mortgage that was taken out on this home.
Original Mortgage
$100,800
Interest Rate
4.89%
Create a Home Valuation Report for This Property
The Home Valuation Report is an in-depth analysis detailing your home's value as well as a comparison with similar homes in the area
Home Values in the Area
Average Home Value in this Area
Purchase History
| Date | Buyer | Sale Price | Title Company |
|---|---|---|---|
| Hall Ronnie J | $136,120 | -- | |
| Hall Ronnie J | $143,000 | -- | |
| Landmark Properties Llc | $110,000 | -- | |
| Craft Jerry R | -- | -- |
Source: Public Records
Mortgage History
| Date | Status | Borrower | Loan Amount |
|---|---|---|---|
| Previous Owner | Hall Ronnie J | $140,409 | |
| Previous Owner | Craft Jerry R | $100,800 | |
| Previous Owner | Craft Jerry R | $128,000 |
Source: Public Records
Tax History Compared to Growth
Tax History
| Year | Tax Paid | Tax Assessment Tax Assessment Total Assessment is a certain percentage of the fair market value that is determined by local assessors to be the total taxable value of land and additions on the property. | Land | Improvement |
|---|---|---|---|---|
| 2024 | $826 | $21,460 | $3,460 | $18,000 |
| 2023 | $826 | $19,820 | $0 | $0 |
| 2022 | $649 | $17,080 | $0 | $0 |
| 2021 | $647 | $17,040 | $0 | $0 |
| 2020 | $610 | $16,120 | $0 | $0 |
| 2019 | $586 | $15,540 | $0 | $0 |
| 2018 | $586 | $15,540 | $0 | $0 |
| 2017 | $547 | $14,580 | $0 | $0 |
| 2016 | $509 | $27,240 | $0 | $0 |
| 2013 | -- | $0 | $0 | $0 |
Source: Public Records
Map
Nearby Homes