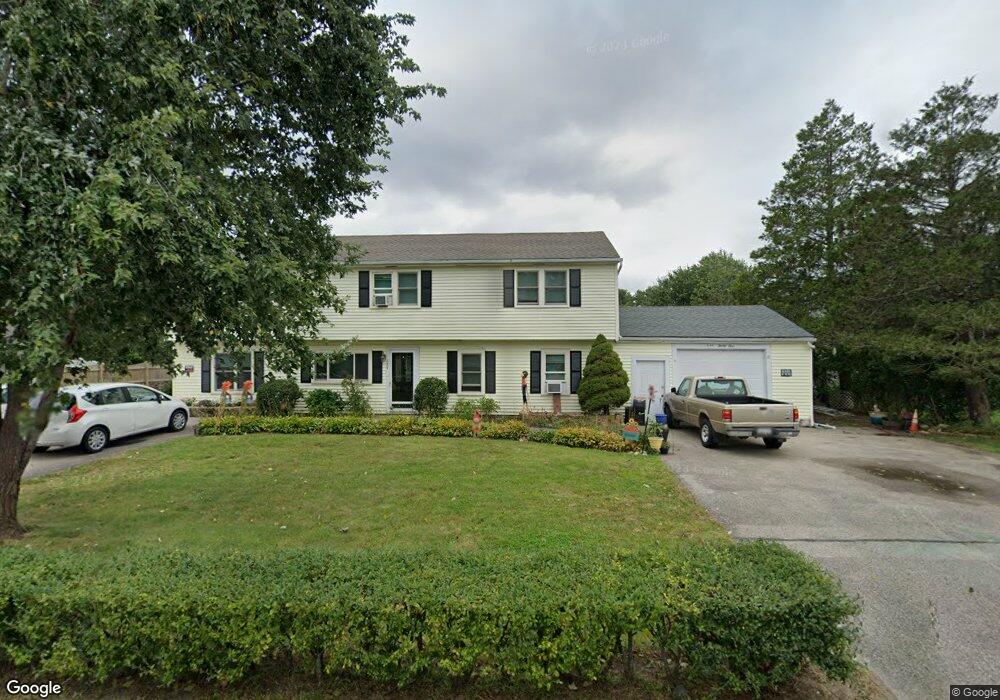
134 Hancock St Abington, MA 02351
Estimated Value: $694,000 - $734,000
4
Beds
3
Baths
2,448
Sq Ft
$293/Sq Ft
Est. Value
About This Home
This home is located at 134 Hancock St, Abington, MA 02351 and is currently estimated at $716,256, approximately $292 per square foot. 134 Hancock St is a home located in Plymouth County with nearby schools including Woodsdale School, Beaver Brook Elementary School, and Abington Middle School.
Ownership History
Date
Name
Owned For
Owner Type
Purchase Details
Closed on
Nov 18, 2024
Sold by
Walsh Mary L and Walsh Pamela J
Bought by
Walsh Mary L and Walsh Pamela J
Current Estimated Value
Purchase Details
Closed on
Jan 25, 2002
Sold by
Fitzpatrick George and Fitzpatrick Maureen A
Bought by
Walsh Kenneth R and Walsh Mary L
Home Financials for this Owner
Home Financials are based on the most recent Mortgage that was taken out on this home.
Original Mortgage
$200,000
Interest Rate
7.08%
Mortgage Type
Purchase Money Mortgage
Create a Home Valuation Report for This Property
The Home Valuation Report is an in-depth analysis detailing your home's value as well as a comparison with similar homes in the area
Home Values in the Area
Average Home Value in this Area
Purchase History
| Date | Buyer | Sale Price | Title Company |
|---|---|---|---|
| Walsh Mary L | -- | None Available | |
| Walsh Mary L | -- | None Available | |
| Walsh Kenneth R | $270,000 | -- | |
| Walsh Kenneth R | $270,000 | -- |
Source: Public Records
Mortgage History
| Date | Status | Borrower | Loan Amount |
|---|---|---|---|
| Previous Owner | Walsh Kenneth R | $200,000 |
Source: Public Records
Tax History Compared to Growth
Tax History
| Year | Tax Paid | Tax Assessment Tax Assessment Total Assessment is a certain percentage of the fair market value that is determined by local assessors to be the total taxable value of land and additions on the property. | Land | Improvement |
|---|---|---|---|---|
| 2025 | $7,432 | $569,100 | $243,200 | $325,900 |
| 2024 | $7,206 | $538,600 | $221,500 | $317,100 |
| 2023 | $6,774 | $476,700 | $193,100 | $283,600 |
| 2022 | $6,761 | $444,200 | $169,500 | $274,700 |
| 2021 | $6,253 | $379,400 | $154,100 | $225,300 |
| 2020 | $6,327 | $372,200 | $149,500 | $222,700 |
| 2019 | $6,187 | $355,800 | $142,600 | $213,200 |
| 2018 | $3,994 | $333,800 | $142,600 | $191,200 |
| 2017 | $5,962 | $324,900 | $142,600 | $182,300 |
| 2016 | $5,573 | $310,800 | $136,000 | $174,800 |
| 2015 | $5,154 | $303,200 | $136,000 | $167,200 |
Source: Public Records
Map
Nearby Homes
- 116 Hancock St
- 164 Hancock St
- 209 Hancock St
- 332 Hancock St
- 89 Presidential Dr
- 257 Rockland St Unit 257
- 333 Groveland St
- 451 Lincoln St
- 37 Rockland St
- 193 Linwood St
- 34 George h Gillespie Way
- 10 Bank St
- 40 Bedford St
- 28 Sylvan Ct
- 5 Chamberlain St
- 133 Andrew Ford Way
- 89 Andrew Ford Way
- 676 Bedford St
- 1210 Washington St
- 0 Bedford St