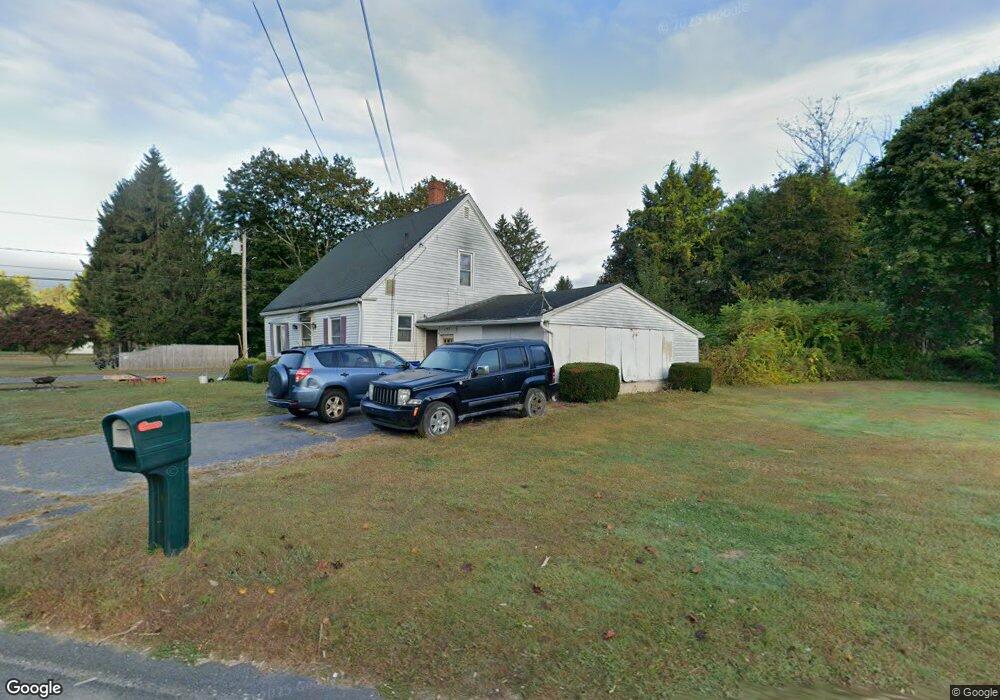
134 Hendrick St Easthampton, MA 01027
Estimated Value: $332,000 - $409,000
4
Beds
2
Baths
1,260
Sq Ft
$285/Sq Ft
Est. Value
About This Home
This home is located at 134 Hendrick St, Easthampton, MA 01027 and is currently estimated at $359,413, approximately $285 per square foot. 134 Hendrick St is a home located in Hampshire County with nearby schools including Easthampton High School, Tri-County Schools, and New England Adolescent Research Institute.
Ownership History
Date
Name
Owned For
Owner Type
Purchase Details
Closed on
Apr 29, 2015
Sold by
Polito Brenda A
Bought by
Polito John D and Clapp Carl A
Current Estimated Value
Create a Home Valuation Report for This Property
The Home Valuation Report is an in-depth analysis detailing your home's value as well as a comparison with similar homes in the area
Home Values in the Area
Average Home Value in this Area
Purchase History
| Date | Buyer | Sale Price | Title Company |
|---|---|---|---|
| Polito John D | -- | -- |
Source: Public Records
Tax History
| Year | Tax Paid | Tax Assessment Tax Assessment Total Assessment is a certain percentage of the fair market value that is determined by local assessors to be the total taxable value of land and additions on the property. | Land | Improvement |
|---|---|---|---|---|
| 2025 | $4,042 | $295,700 | $116,000 | $179,700 |
| 2024 | $3,899 | $287,500 | $112,500 | $175,000 |
| 2023 | $2,940 | $200,700 | $88,100 | $112,600 |
| 2022 | $3,318 | $200,700 | $88,100 | $112,600 |
| 2021 | $3,645 | $207,800 | $88,100 | $119,700 |
| 2020 | $3,564 | $200,700 | $88,100 | $112,600 |
| 2019 | $2,995 | $193,700 | $88,100 | $105,600 |
| 2018 | $2,888 | $180,500 | $83,200 | $97,300 |
| 2017 | $2,816 | $173,700 | $79,900 | $93,800 |
| 2016 | $2,727 | $174,900 | $79,900 | $95,000 |
| 2015 | $2,650 | $174,900 | $79,900 | $95,000 |
Source: Public Records
Map
Nearby Homes
Your Personal Tour Guide
Ask me questions while you tour the home.