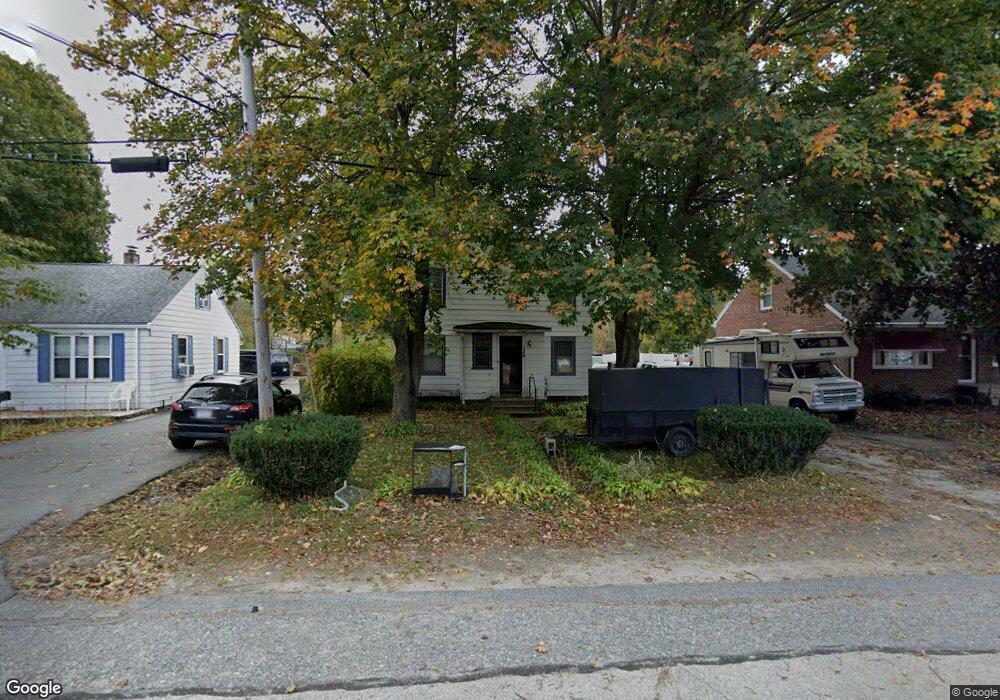
134 Main St Oxford, MA 01540
Estimated Value: $414,000 - $598,000
4
Beds
2
Baths
2,120
Sq Ft
$223/Sq Ft
Est. Value
About This Home
This home is located at 134 Main St, Oxford, MA 01540 and is currently estimated at $472,159, approximately $222 per square foot. 134 Main St is a home located in Worcester County with nearby schools including Alfred M Chaffee, Oxford High School, and Clara Barton Elementary School.
Ownership History
Date
Name
Owned For
Owner Type
Purchase Details
Closed on
Feb 22, 2005
Sold by
Farrar Charlene M
Bought by
Ricard Holly T and Ricard John J
Current Estimated Value
Home Financials for this Owner
Home Financials are based on the most recent Mortgage that was taken out on this home.
Original Mortgage
$180,000
Outstanding Balance
$91,672
Interest Rate
5.78%
Mortgage Type
Purchase Money Mortgage
Estimated Equity
$380,487
Purchase Details
Closed on
Jul 18, 2002
Sold by
Yeagle Helen G
Bought by
Farrar Charlene M
Home Financials for this Owner
Home Financials are based on the most recent Mortgage that was taken out on this home.
Original Mortgage
$170,000
Interest Rate
6.73%
Mortgage Type
Purchase Money Mortgage
Create a Home Valuation Report for This Property
The Home Valuation Report is an in-depth analysis detailing your home's value as well as a comparison with similar homes in the area
Home Values in the Area
Average Home Value in this Area
Purchase History
| Date | Buyer | Sale Price | Title Company |
|---|---|---|---|
| Ricard Holly T | $225,000 | -- | |
| Farrar Charlene M | $170,000 | -- |
Source: Public Records
Mortgage History
| Date | Status | Borrower | Loan Amount |
|---|---|---|---|
| Open | Ricard Holly T | $180,000 | |
| Previous Owner | Farrar Charlene M | $170,000 | |
| Previous Owner | Farrar Charlene M | $25,000 |
Source: Public Records
Tax History Compared to Growth
Tax History
| Year | Tax Paid | Tax Assessment Tax Assessment Total Assessment is a certain percentage of the fair market value that is determined by local assessors to be the total taxable value of land and additions on the property. | Land | Improvement |
|---|---|---|---|---|
| 2025 | $44 | $343,500 | $84,600 | $258,900 |
| 2024 | $4,291 | $318,300 | $78,600 | $239,700 |
| 2023 | $4,293 | $314,700 | $70,200 | $244,500 |
| 2022 | $4,176 | $258,400 | $63,300 | $195,100 |
| 2021 | $3,903 | $236,100 | $60,100 | $176,000 |
| 2020 | $3,625 | $217,600 | $60,100 | $157,500 |
| 2019 | $2,990 | $175,600 | $60,100 | $115,500 |
| 2018 | $3,033 | $175,600 | $60,100 | $115,500 |
| 2017 | $3,057 | $181,400 | $60,100 | $121,300 |
| 2016 | $3,071 | $181,400 | $60,100 | $121,300 |
| 2015 | $2,864 | $181,400 | $60,100 | $121,300 |
| 2014 | $2,837 | $189,100 | $60,100 | $129,000 |
Source: Public Records
Map
Nearby Homes