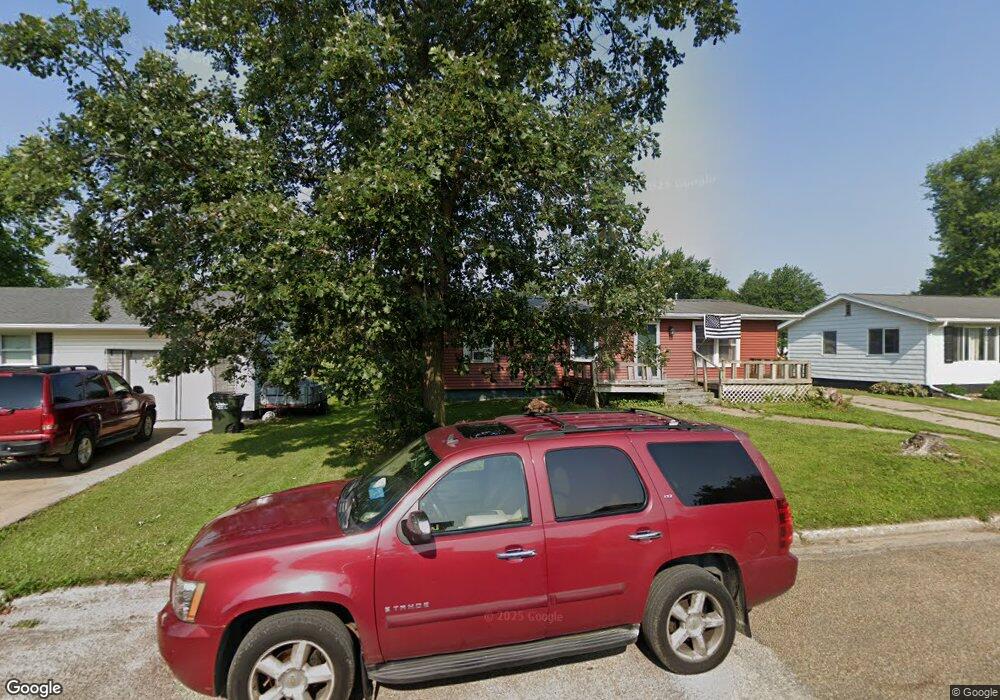
134 Maple Dr Mediapolis, IA 52637
Estimated Value: $184,758 - $199,000
3
Beds
2
Baths
1,056
Sq Ft
$181/Sq Ft
Est. Value
About This Home
This home is located at 134 Maple Dr, Mediapolis, IA 52637 and is currently estimated at $190,940, approximately $180 per square foot. 134 Maple Dr is a home located in Des Moines County with nearby schools including Mediapolis Elementary School, Mediapolis Community Middle School, and Mediapolis High School.
Ownership History
Date
Name
Owned For
Owner Type
Purchase Details
Closed on
Sep 29, 2011
Sold by
Pierson David R and Pierson Alisa Faye
Bought by
Lofthus Joshua A
Current Estimated Value
Home Financials for this Owner
Home Financials are based on the most recent Mortgage that was taken out on this home.
Original Mortgage
$87,718
Outstanding Balance
$59,954
Interest Rate
4.22%
Mortgage Type
FHA
Estimated Equity
$130,986
Create a Home Valuation Report for This Property
The Home Valuation Report is an in-depth analysis detailing your home's value as well as a comparison with similar homes in the area
Home Values in the Area
Average Home Value in this Area
Purchase History
| Date | Buyer | Sale Price | Title Company |
|---|---|---|---|
| Lofthus Joshua A | $90,000 | None Available |
Source: Public Records
Mortgage History
| Date | Status | Borrower | Loan Amount |
|---|---|---|---|
| Open | Lofthus Joshua A | $87,718 |
Source: Public Records
Tax History Compared to Growth
Tax History
| Year | Tax Paid | Tax Assessment Tax Assessment Total Assessment is a certain percentage of the fair market value that is determined by local assessors to be the total taxable value of land and additions on the property. | Land | Improvement |
|---|---|---|---|---|
| 2025 | $2,010 | $168,900 | $15,200 | $153,700 |
| 2024 | $2,010 | $148,700 | $15,200 | $133,500 |
| 2023 | $1,954 | $148,700 | $15,200 | $133,500 |
| 2022 | $1,922 | $127,700 | $15,200 | $112,500 |
| 2021 | $1,922 | $127,700 | $15,200 | $112,500 |
| 2020 | $2,014 | $127,700 | $15,200 | $112,500 |
| 2019 | $1,686 | $127,700 | $15,200 | $112,500 |
| 2018 | $1,656 | $102,400 | $15,200 | $87,200 |
| 2017 | $1,662 | $100,200 | $0 | $0 |
| 2016 | $1,622 | $100,200 | $0 | $0 |
| 2015 | $1,622 | $100,200 | $0 | $0 |
| 2014 | $1,636 | $94,200 | $0 | $0 |
Source: Public Records
Map
Nearby Homes
- 1119 Main St
- 1011 Middle St
- 206 S Sunnyside St
- 209 Laci Dru
- 205 Laci Dru
- 201 Laci Dru
- 800 High St
- 24316 80th Ave
- 15346 Dodgeville Rd
- 10361 155th St
- TBD Iowa City Rd
- 101 SE Union St
- 310 S Church St
- 208 E Division St
- 103 N Vine St
- 4246 U S 61
- 201 N Church St
- 207 N Church St
- 3556 Highway 99
- 13186 Cedar Hills Dr