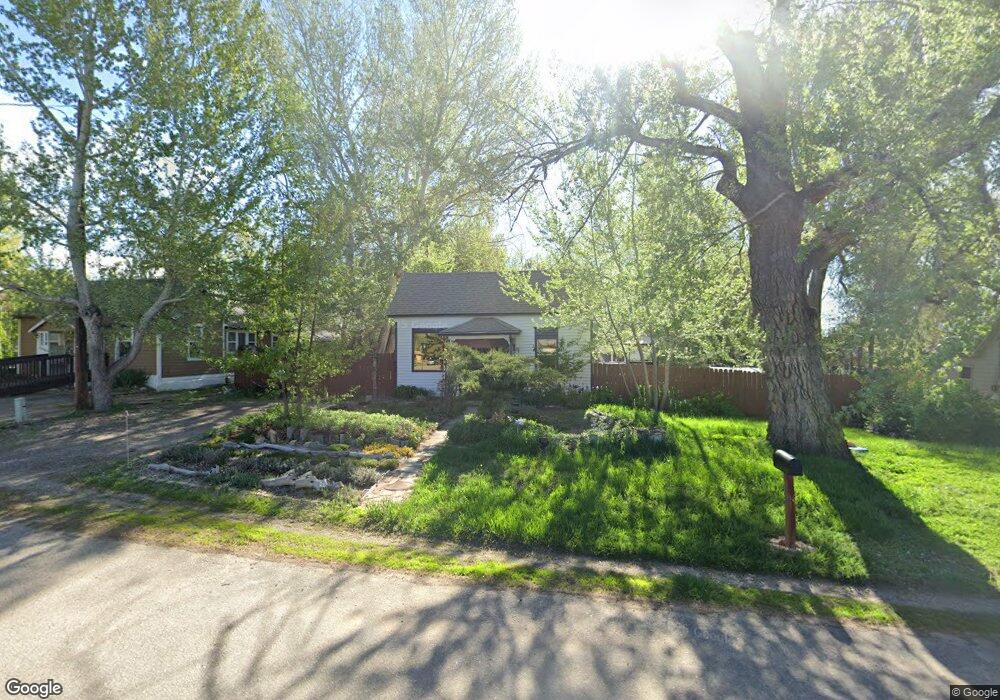
134 S Monroe Ave Loveland, CO 80537
Estimated Value: $297,000 - $311,000
1
Bed
1
Bath
648
Sq Ft
$469/Sq Ft
Est. Value
About This Home
This home is located at 134 S Monroe Ave, Loveland, CO 80537 and is currently estimated at $303,861, approximately $468 per square foot. 134 S Monroe Ave is a home located in Larimer County with nearby schools including Winona Elementary School, Peakview Academy at Conrad Ball, and Mountain View High School.
Ownership History
Date
Name
Owned For
Owner Type
Purchase Details
Closed on
Jul 8, 2011
Sold by
Golla Venkata Krishna and Golla Renuka
Bought by
Cooper Susan R
Current Estimated Value
Home Financials for this Owner
Home Financials are based on the most recent Mortgage that was taken out on this home.
Original Mortgage
$85,000
Interest Rate
4.37%
Mortgage Type
Seller Take Back
Purchase Details
Closed on
Nov 2, 2010
Sold by
Nationstar Mortgage Llc
Bought by
Golla Venkata Krishna and Golla Renuka
Purchase Details
Closed on
Jul 20, 2010
Sold by
Hernandez Rose M
Bought by
Nationstar Mortgage Llc
Purchase Details
Closed on
Jul 16, 2001
Sold by
Hernandez John S and Hernandez Ruth A
Bought by
Hernandez John S
Purchase Details
Closed on
Aug 1, 1988
Bought by
Hernandez John S and Hernandez Ruth A
Create a Home Valuation Report for This Property
The Home Valuation Report is an in-depth analysis detailing your home's value as well as a comparison with similar homes in the area
Home Values in the Area
Average Home Value in this Area
Purchase History
| Date | Buyer | Sale Price | Title Company |
|---|---|---|---|
| Cooper Susan R | $105,000 | Fidelity National Title Insu | |
| Golla Venkata Krishna | $50,000 | Assured Title | |
| Nationstar Mortgage Llc | -- | None Available | |
| Hernandez John S | -- | -- | |
| Hernandez John S | $18,500 | -- |
Source: Public Records
Mortgage History
| Date | Status | Borrower | Loan Amount |
|---|---|---|---|
| Closed | Cooper Susan R | $85,000 |
Source: Public Records
Tax History Compared to Growth
Tax History
| Year | Tax Paid | Tax Assessment Tax Assessment Total Assessment is a certain percentage of the fair market value that is determined by local assessors to be the total taxable value of land and additions on the property. | Land | Improvement |
|---|---|---|---|---|
| 2025 | $818 | $20,435 | $3,350 | $17,085 |
| 2024 | $790 | $20,435 | $3,350 | $17,085 |
| 2022 | $685 | $15,638 | $3,475 | $12,163 |
| 2021 | $1,265 | $16,088 | $3,575 | $12,513 |
| 2020 | $894 | $11,361 | $3,575 | $7,786 |
| 2019 | $878 | $11,361 | $3,575 | $7,786 |
| 2018 | $791 | $9,713 | $3,600 | $6,113 |
| 2017 | $681 | $9,713 | $3,600 | $6,113 |
| 2016 | $604 | $8,326 | $3,980 | $4,346 |
| 2015 | $599 | $8,330 | $3,980 | $4,350 |
| 2014 | $524 | $7,040 | $3,980 | $3,060 |
Source: Public Records
Map
Nearby Homes
- 108 S Jefferson Ave
- 1064 E 1st St
- 199 S Jefferson Ave Unit 205
- 203 N Jefferson Ave
- 116 S Lincoln Ave
- 715 E 4th St
- 108 S Cleveland Ave
- 535 N Adams Ave
- 1144 E 5th St
- 853 E 7th St
- 143 W 2nd St
- 264 Dean Cir Unit 264
- 205 E 6th St Unit 300
- 205 E 6th St Unit 301
- 205 E 6th St Unit 200
- 205 E 6th St Unit 400
- 205 E 6th St Unit 204
- 205 E 6th St Unit 305
- 205 E 6th St Unit 202
- 205 E 6th St Unit 303
- 128 S Monroe Ave
- 202 S Monroe Ave
- 124 S Monroe Ave
- 118 S Monroe Ave
- 614 2nd St SE
- 116 S Monroe Ave
- 615 2nd St SE
- 127 S Monroe Ave
- 613 2nd St SE
- 816 E 1st St
- 610 2nd St SE
- 206 S Monroe Ave
- 111 S Monroe Ave
- 131 S Monroe Ave
- 730 E 1st St
- 609 2nd St SE
- 606 2nd St SE
- 106 S Monroe Ave
- 760 E 1st St
- 107 S Monroe Ave