K
Landlord's Agent in 2022
Keri Archambault
Keller Williams Leading Edge
(401) 323-6643
1 in this area
10 Total Sales
Estimated Value: $449,000 - $510,000
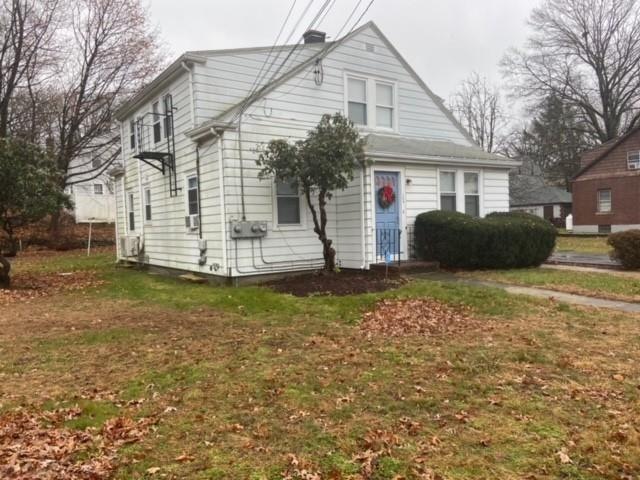
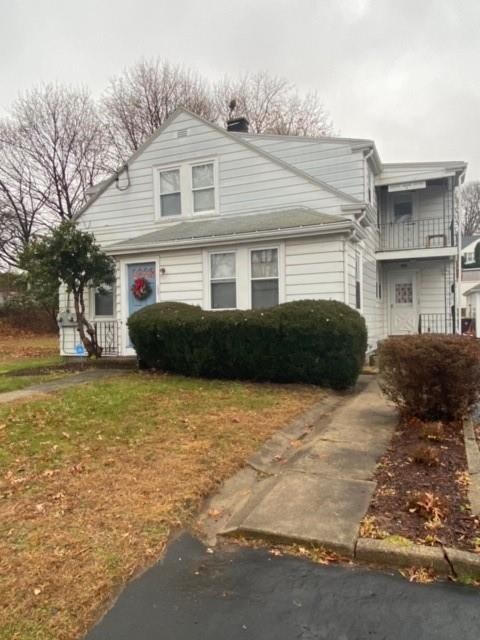
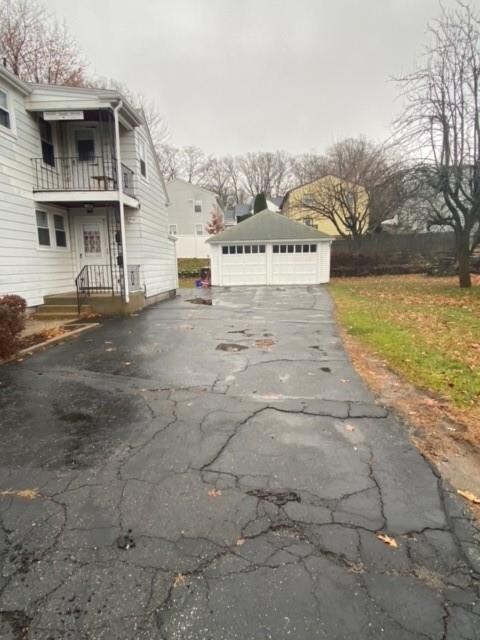
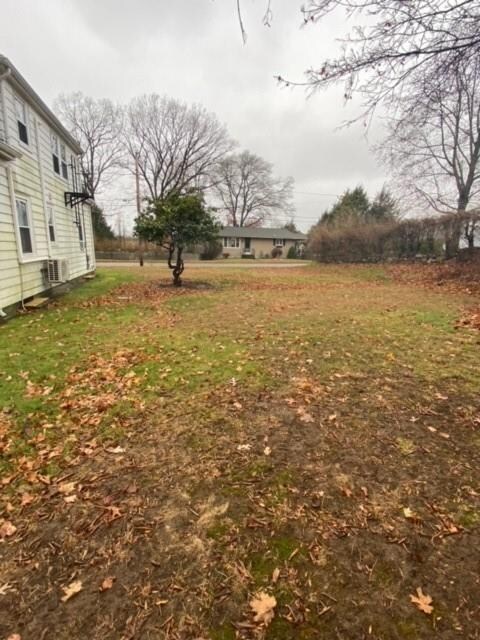
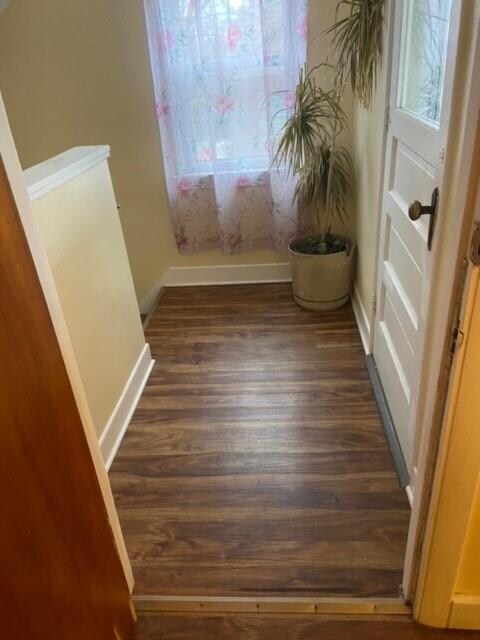
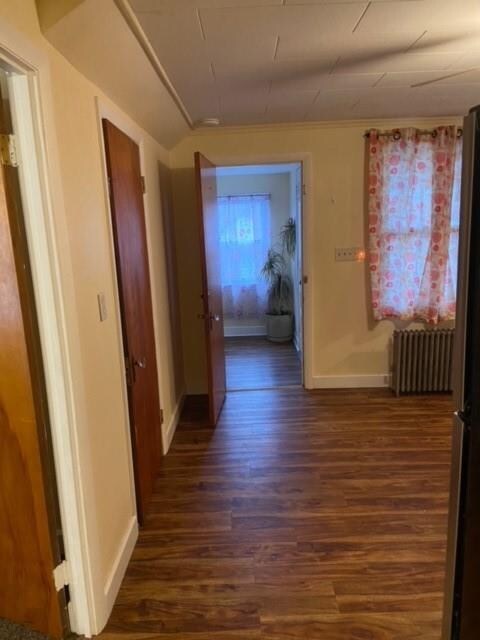
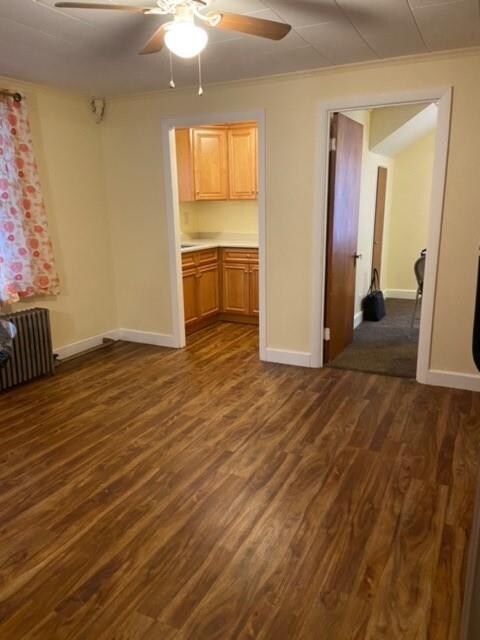
Welcome to 134 Saint Cecile Ave! This rental is located in a great family neighborhood featuring a large yard not usually found in a rental property. This unit features 2 bedrooms, 1 bath and is close to shopping, restaurants, easy highway access, not far from the MA line. Newer kitchen, plenty of storage including one bay of 2 car garage, off-street parking. This unit also features efficient heating & Air Conditioning through separate mini-split units. Applicants must pass a background & credit check and be able to provide references. First Month's Rent & Security REQUIRED. Rentals like this are hard to come by so don't miss out!! Contact listing agent today!!
Last Agent to Rent the Property
Keller Williams Leading Edge License #RES.0044770 Listed on: 01/03/2022

Last Renter's Agent
Keller Williams Leading Edge License #RES.0044770 Listed on: 01/03/2022
| Date | Event | Price | List to Sale | Price per Sq Ft |
|---|---|---|---|---|
| 01/03/2022 01/03/22 | For Rent | $1,300 | 0.0% | -- |
| 01/03/2022 01/03/22 | Rented | $1,300 | -- | -- |
| Year | Tax Paid | Tax Assessment Tax Assessment Total Assessment is a certain percentage of the fair market value that is determined by local assessors to be the total taxable value of land and additions on the property. | Land | Improvement |
|---|---|---|---|---|
| 2025 | $4,815 | $428,800 | $102,900 | $325,900 |
| 2024 | $4,401 | $302,700 | $97,800 | $204,900 |
| 2023 | $4,232 | $302,700 | $97,800 | $204,900 |
| 2022 | $4,232 | $302,700 | $97,800 | $204,900 |
| 2021 | $3,933 | $165,600 | $66,000 | $99,600 |
| 2020 | $3,974 | $165,600 | $66,000 | $99,600 |
| 2018 | $3,988 | $165,600 | $66,000 | $99,600 |
| 2017 | $4,452 | $147,900 | $57,500 | $90,400 |
| 2016 | $4,709 | $147,900 | $57,500 | $90,400 |
| 2015 | $5,410 | $147,900 | $57,500 | $90,400 |
| 2014 | $4,748 | $147,600 | $63,200 | $84,400 |
K
Landlord's Agent in 2022
Keri Archambault
Keller Williams Leading Edge
(401) 323-6643
1 in this area
10 Total Sales
Source: State-Wide MLS
MLS Number: 1300887
APN: WOON-000038K-000337-000031
Disclaimer: Certain information contained herein is derived from information provided by parties other than Homes.com. All information provided is deemed reliable, but is not guaranteed to be accurate and should be independently verified.
![]() IDX information is provided exclusively for personal, non-commercial use, and may not be used for any purpose other than to identify prospective properties consumers may be interested in purchasing. Information is deemed reliable but not guaranteed.
IDX information is provided exclusively for personal, non-commercial use, and may not be used for any purpose other than to identify prospective properties consumers may be interested in purchasing. Information is deemed reliable but not guaranteed.
Copyright © 2025 State-Wide MLS, Inc. All rights reserved.