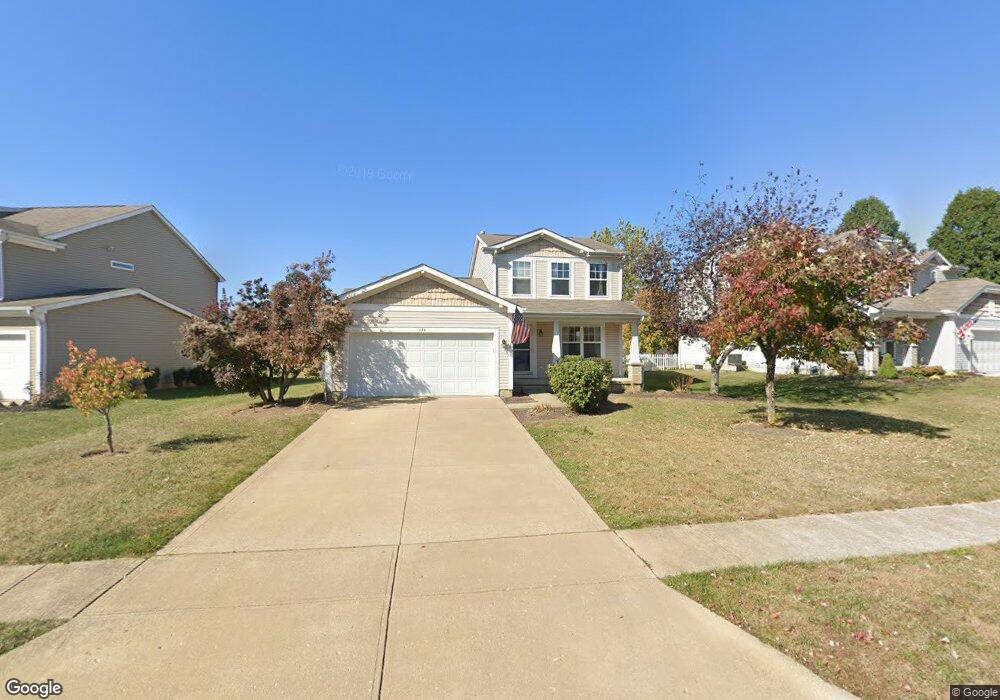
134 Stone Hedge Row Dr Johnstown, OH 43031
Estimated Value: $315,000 - $413,000
3
Beds
3
Baths
1,544
Sq Ft
$242/Sq Ft
Est. Value
About This Home
This home is located at 134 Stone Hedge Row Dr, Johnstown, OH 43031 and is currently estimated at $373,338, approximately $241 per square foot. 134 Stone Hedge Row Dr is a home located in Licking County with nearby schools including Johnstown Middle School and Johnstown High School.
Ownership History
Date
Name
Owned For
Owner Type
Purchase Details
Closed on
Nov 9, 2017
Sold by
Jpmorgan Chase Bank Na
Bought by
Scarberry Bradley Seth
Current Estimated Value
Purchase Details
Closed on
Apr 4, 2009
Sold by
Merriman Smith Penny F and Smith Lloyd V
Bought by
Rader Eric and Rader Tiffany
Home Financials for this Owner
Home Financials are based on the most recent Mortgage that was taken out on this home.
Original Mortgage
$170,442
Interest Rate
5.05%
Mortgage Type
Unknown
Purchase Details
Closed on
Jun 9, 2003
Sold by
Technical Rubber Investment Co
Bought by
Regent Homes Llc
Create a Home Valuation Report for This Property
The Home Valuation Report is an in-depth analysis detailing your home's value as well as a comparison with similar homes in the area
Home Values in the Area
Average Home Value in this Area
Purchase History
| Date | Buyer | Sale Price | Title Company |
|---|---|---|---|
| Scarberry Bradley Seth | $185,000 | None Available | |
| Rader Eric | $167,100 | Landameric | |
| Regent Homes Llc | $31,300 | -- |
Source: Public Records
Mortgage History
| Date | Status | Borrower | Loan Amount |
|---|---|---|---|
| Previous Owner | Rader Eric | $170,442 |
Source: Public Records
Tax History
| Year | Tax Paid | Tax Assessment Tax Assessment Total Assessment is a certain percentage of the fair market value that is determined by local assessors to be the total taxable value of land and additions on the property. | Land | Improvement |
|---|---|---|---|---|
| 2024 | $3,986 | $93,490 | $26,570 | $66,920 |
| 2023 | $4,017 | $93,490 | $26,570 | $66,920 |
| 2022 | $3,161 | $69,160 | $19,950 | $49,210 |
| 2021 | $3,306 | $69,160 | $19,950 | $49,210 |
| 2020 | $3,343 | $69,160 | $19,950 | $49,210 |
| 2019 | $3,164 | $60,170 | $13,300 | $46,870 |
| 2018 | $3,183 | $0 | $0 | $0 |
| 2017 | $1,708 | $0 | $0 | $0 |
| 2016 | $2,832 | $0 | $0 | $0 |
| 2015 | $2,882 | $0 | $0 | $0 |
| 2014 | $3,851 | $0 | $0 | $0 |
| 2013 | $2,472 | $0 | $0 | $0 |
Source: Public Records
Map
Nearby Homes
- 207 Autumn Leaves Way
- 270 N Oregon St
- 40 W Maple St
- 102 Parkdale Dr
- 306 Eagles Nest Ave
- 111 Edwards Rd
- 325 Green Acres Dr
- 93 W College Ave
- 150 Valleyview Dr
- 283 S Main St
- 320 S Main St
- 152 Elm St
- 405 Tyler Station Dr
- 562 Cannondale Ave
- 557 Cannondale Ave
- 483 Lewis Ct
- 97 Crossing Place
- 213 De Rosa Dr
- 33 Westview Dr
- 332 Bottecchia Blvd
- 146 Stone Hedge Row Dr
- 122 Stone Hedge Row Dr
- 158 Stone Hedge Row Dr
- 110 Stone Hedge Row Dr
- 170 Stone Hedge Row Dr
- 129 Stone Hedge Row Dr
- 119 Stone Hedge Row Dr
- 166 Sassafrass Place
- 182 Stone Hedge Row Dr
- 107 Stone Hedge Row Dr
- 95 Stone Hedge Row Dr
- 194 Stone Hedge Row Dr
- 165 Sassafrass Place
- 83 Stone Hedge Row Dr
- 204 Stone Hedge Row Dr
- 148 Sassafrass Place
- 169 Stone Hedge Row Dr
- 81 Pepperwood Place
- 216 Stone Hedge Row Dr
- 147 Sassafrass Place
Your Personal Tour Guide
Ask me questions while you tour the home.