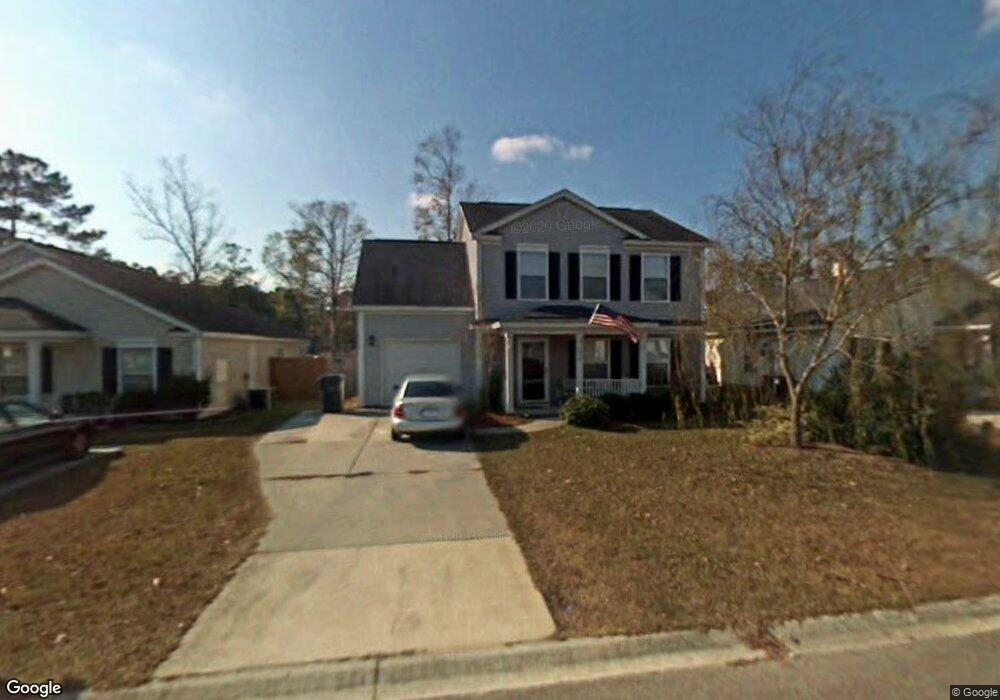
134 Two Pond Loop Ladson, SC 29456
Estimated Value: $276,000 - $302,000
3
Beds
3
Baths
1,529
Sq Ft
$191/Sq Ft
Est. Value
About This Home
This home is located at 134 Two Pond Loop, Ladson, SC 29456 and is currently estimated at $292,169, approximately $191 per square foot. 134 Two Pond Loop is a home located in Dorchester County with nearby schools including Joseph R. Pye Elementary, Oakbrook Middle School, and Ashley Ridge High School.
Ownership History
Date
Name
Owned For
Owner Type
Purchase Details
Closed on
Nov 28, 2006
Sold by
Withrow Alex J
Bought by
Peterson Brent A and Peterson Kathryn A
Current Estimated Value
Home Financials for this Owner
Home Financials are based on the most recent Mortgage that was taken out on this home.
Original Mortgage
$166,504
Outstanding Balance
$98,420
Interest Rate
6.29%
Mortgage Type
VA
Estimated Equity
$193,749
Purchase Details
Closed on
Jul 19, 2005
Sold by
Maddox Brandi R
Bought by
Withrow Alex J
Home Financials for this Owner
Home Financials are based on the most recent Mortgage that was taken out on this home.
Original Mortgage
$143,520
Interest Rate
5.59%
Mortgage Type
VA
Purchase Details
Closed on
Apr 30, 2002
Sold by
Lange Jean M and Greer Jean
Bought by
Maddox Brandi R
Purchase Details
Closed on
Jun 23, 2000
Sold by
Beazer Homes Corp
Bought by
Lange Jean M
Purchase Details
Closed on
Feb 25, 2000
Sold by
Akj Investments Llc
Bought by
Beazer Homes Corp
Create a Home Valuation Report for This Property
The Home Valuation Report is an in-depth analysis detailing your home's value as well as a comparison with similar homes in the area
Home Values in the Area
Average Home Value in this Area
Purchase History
| Date | Buyer | Sale Price | Title Company |
|---|---|---|---|
| Peterson Brent A | $163,000 | None Available | |
| Withrow Alex J | $140,500 | -- | |
| Maddox Brandi R | $125,000 | -- | |
| Lange Jean M | $115,295 | -- | |
| Beazer Homes Corp | $129,510 | -- |
Source: Public Records
Mortgage History
| Date | Status | Borrower | Loan Amount |
|---|---|---|---|
| Open | Peterson Brent A | $166,504 | |
| Previous Owner | Withrow Alex J | $143,520 |
Source: Public Records
Tax History
| Year | Tax Paid | Tax Assessment Tax Assessment Total Assessment is a certain percentage of the fair market value that is determined by local assessors to be the total taxable value of land and additions on the property. | Land | Improvement |
|---|---|---|---|---|
| 2025 | $4,908 | $17,608 | $6,840 | $10,768 |
| 2024 | $1,931 | $11,739 | $4,560 | $7,179 |
| 2023 | $1,931 | $7,221 | $1,600 | $5,621 |
| 2022 | $1,565 | $6,500 | $1,380 | $5,120 |
| 2021 | $1,668 | $6,500 | $1,380 | $5,120 |
| 2020 | $1,540 | $5,650 | $1,200 | $4,450 |
| 2019 | $1,504 | $5,650 | $1,200 | $4,450 |
| 2018 | $3,443 | $5,650 | $1,200 | $4,450 |
| 2017 | $1,305 | $5,650 | $1,200 | $4,450 |
| 2016 | $3,356 | $5,650 | $1,200 | $4,450 |
| 2015 | $1,288 | $5,650 | $1,200 | $4,450 |
| 2014 | $1,233 | $136,965 | $0 | $0 |
| 2013 | -- | $5,480 | $0 | $0 |
Source: Public Records
Map
Nearby Homes
- 120 Two Pond Loop
- 202 Elliott Dr
- 9631 Crosscut Dr
- 206 Limehouse Dr
- 224 Withers Ln
- 218 Withers Ln
- 208 Terrace View Dr
- 201 Ibis Dr
- 1001 Margaret Dr
- 217 Beverly Dr
- 9875 Jamison Rd
- 203 Ibis Dr
- 203 Terrace View Dr
- 101 Wood Side Dr
- 9658 Jamison Rd
- 52 Regency Oaks Dr
- 293 Chemistry Cir
- 203 Oakmont Ave Unit B
- 278 Chemistry Cir
- 91 Cross Timbers Dr
- 132 Two Pond Loop
- 136 Two Pond Loop
- 138 Two Pond Loop
- 130 Two Pond Loop
- 138 2 Pond Loop
- 128 Two Pond Loop
- 140 Two Pond Loop
- 133 2 Pond Loop
- 133 Two Pond Loop
- 135 Two Pond Loop
- 106 Tuscany Ct
- 131 Two Pond Loop
- 108 Tuscany Ct
- 139 Two Pond Loop
- 110 Tuscany Ct
- 112 Tuscany Ct
- 142 Two Pond Loop
- 127 Two Pond Loop
- 126 Two Pond Loop
- 114 Tuscany Ct
Your Personal Tour Guide
Ask me questions while you tour the home.