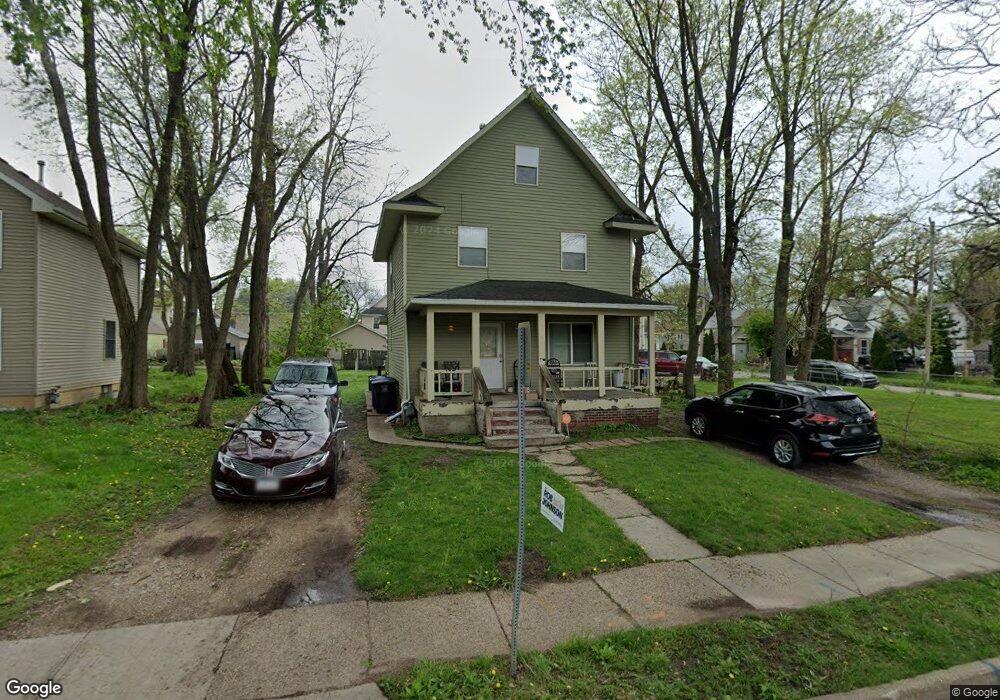
1340 Clark St Des Moines, IA 50314
Mondamin Presidential NeighborhoodEstimated Value: $148,000 - $211,000
4
Beds
2
Baths
1,314
Sq Ft
$138/Sq Ft
Est. Value
About This Home
This home is located at 1340 Clark St, Des Moines, IA 50314 and is currently estimated at $181,590, approximately $138 per square foot. 1340 Clark St is a home located in Polk County with nearby schools including King Elementary School, Callanan Middle School, and Roosevelt High School.
Ownership History
Date
Name
Owned For
Owner Type
Purchase Details
Closed on
Nov 16, 2009
Sold by
Reyes Sahara S
Bought by
Stiefvater Sharlett
Current Estimated Value
Home Financials for this Owner
Home Financials are based on the most recent Mortgage that was taken out on this home.
Original Mortgage
$88,369
Outstanding Balance
$57,406
Interest Rate
4.9%
Mortgage Type
FHA
Estimated Equity
$124,184
Purchase Details
Closed on
Jun 6, 2008
Sold by
Dutch Fork Capital Llc
Bought by
Reyes Sahara S
Purchase Details
Closed on
Jan 25, 2007
Sold by
Jpmorgan Chase Bank
Bought by
Dutch Fork Capital Llc
Purchase Details
Closed on
Jun 16, 2005
Sold by
Terry Dale Gordon and Terry Andrea P
Bought by
Mortgage Electronic Registration Systems
Purchase Details
Closed on
Jun 27, 2003
Sold by
Talley Andrea R
Bought by
Terry Dale Gordon and Terry Andrea P
Create a Home Valuation Report for This Property
The Home Valuation Report is an in-depth analysis detailing your home's value as well as a comparison with similar homes in the area
Home Values in the Area
Average Home Value in this Area
Purchase History
| Date | Buyer | Sale Price | Title Company |
|---|---|---|---|
| Stiefvater Sharlett | $89,500 | None Available | |
| Reyes Sahara S | $35,500 | Title Services Corporation | |
| Dutch Fork Capital Llc | -- | Title Services Corp | |
| Jpmorgan Chase Bank | -- | Title Services Corp | |
| Mortgage Electronic Registration Systems | $28,500 | -- | |
| Terry Dale Gordon | -- | -- |
Source: Public Records
Mortgage History
| Date | Status | Borrower | Loan Amount |
|---|---|---|---|
| Open | Stiefvater Sharlett | $88,369 |
Source: Public Records
Tax History Compared to Growth
Tax History
| Year | Tax Paid | Tax Assessment Tax Assessment Total Assessment is a certain percentage of the fair market value that is determined by local assessors to be the total taxable value of land and additions on the property. | Land | Improvement |
|---|---|---|---|---|
| 2025 | $2,052 | $132,200 | $13,600 | $118,600 |
| 2024 | $2,052 | $114,800 | $11,700 | $103,100 |
| 2023 | $1,798 | $114,800 | $11,700 | $103,100 |
| 2022 | $1,784 | $85,200 | $8,900 | $76,300 |
| 2021 | $1,684 | $85,200 | $8,900 | $76,300 |
| 2020 | $1,744 | $76,100 | $7,900 | $68,200 |
| 2019 | $1,642 | $76,100 | $7,900 | $68,200 |
| 2018 | $1,620 | $69,600 | $7,000 | $62,600 |
| 2017 | $1,684 | $69,600 | $7,000 | $62,600 |
| 2016 | $1,636 | $70,800 | $7,000 | $63,800 |
| 2015 | $1,636 | $70,800 | $7,000 | $63,800 |
| 2014 | $1,458 | $63,600 | $6,900 | $56,700 |
Source: Public Records
Map
Nearby Homes
- 1341 Clark St
- 1330 Clark St
- 1414 Harrison Ave
- 1514 Harrison Ave
- 1503 13th St
- 1347 Forest Ave
- 1503 Forest Ave
- 1603 Clark St
- 1513 College Ave
- 1457 17th St
- 1604 16th St
- 1423 12th St
- 1334 Washington Ave
- 1608 Mondamin Ave
- 1609 12th St
- 1513 Washington Ave
- 1534 18th St
- 1716 Mondamin Ave
- 1420 10th St
- 1510 9th St