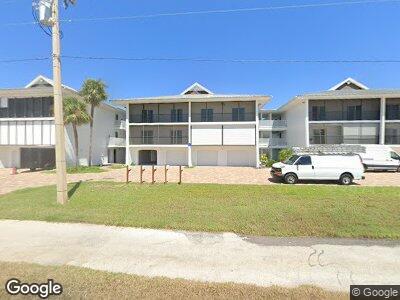
1340 Middle Gulf Dr Unit 8A Sanibel, FL 33957
Sanibel Island NeighborhoodEstimated Value: $516,343 - $1,169,000
2
Beds
2
Baths
1,400
Sq Ft
$595/Sq Ft
Est. Value
About This Home
This home is located at 1340 Middle Gulf Dr Unit 8A, Sanibel, FL 33957 and is currently estimated at $833,086, approximately $595 per square foot. 1340 Middle Gulf Dr Unit 8A is a home located in Lee County with nearby schools including Sanibel Elementary School, Cypress Lake Middle School, and Cypress Lake High School.
Ownership History
Date
Name
Owned For
Owner Type
Purchase Details
Closed on
Dec 23, 2020
Sold by
Kallok Richard A and Kallok Susan J
Bought by
Kallok Richard A and Kallok Susan J
Current Estimated Value
Purchase Details
Closed on
Sep 1, 2012
Sold by
Krakowski James J
Bought by
Kallok Richard A and Kallok Susan J
Home Financials for this Owner
Home Financials are based on the most recent Mortgage that was taken out on this home.
Original Mortgage
$450,000
Outstanding Balance
$320,302
Interest Rate
3.58%
Mortgage Type
Seller Take Back
Estimated Equity
$406,185
Purchase Details
Closed on
Oct 16, 2008
Sold by
Declaratio Fielding Patricia C
Bought by
Fielding Patricia C and The Madison Family Trust
Purchase Details
Closed on
Oct 29, 2003
Sold by
Krakowski Joy P
Bought by
Krakowski Krakowski Joy P Joy P and Joy P Krakowski
Create a Home Valuation Report for This Property
The Home Valuation Report is an in-depth analysis detailing your home's value as well as a comparison with similar homes in the area
Home Values in the Area
Average Home Value in this Area
Purchase History
| Date | Buyer | Sale Price | Title Company |
|---|---|---|---|
| Kallok Richard A | -- | Accommodation | |
| Kallok Richard A | $450,000 | Attorney | |
| Fielding Patricia C | -- | Attorney | |
| Krakowski Krakowski Joy P Joy P | -- | -- |
Source: Public Records
Mortgage History
| Date | Status | Borrower | Loan Amount |
|---|---|---|---|
| Open | Kallok Richard A | $450,000 |
Source: Public Records
Tax History Compared to Growth
Tax History
| Year | Tax Paid | Tax Assessment Tax Assessment Total Assessment is a certain percentage of the fair market value that is determined by local assessors to be the total taxable value of land and additions on the property. | Land | Improvement |
|---|---|---|---|---|
| 2024 | $2,705 | $105,363 | -- | $105,363 |
| 2023 | $2,705 | $187,039 | $0 | $187,039 |
| 2022 | $6,251 | $449,115 | $0 | $0 |
| 2021 | $5,822 | $408,286 | $0 | $408,286 |
| 2020 | $6,019 | $416,670 | $0 | $416,670 |
| 2019 | $6,220 | $427,168 | $0 | $427,168 |
| 2018 | $5,933 | $398,905 | $0 | $398,905 |
| 2017 | $6,379 | $419,093 | $0 | $419,093 |
| 2016 | $1,561 | $100,000 | $0 | $100,000 |
| 2015 | $1,581 | $98,720 | $0 | $98,720 |
| 2014 | $6,629 | $414,200 | $0 | $414,200 |
| 2013 | -- | $372,989 | $0 | $372,989 |
Source: Public Records
Map
Nearby Homes
- 1299 Middle Gulf Dr Unit A191
- 1341 Middle Gulf Dr Unit 5A
- 1341 Middle Gulf Dr Unit 10A
- 1341 Middle Gulf Dr Unit 4C
- 1351 Middle Gulf Dr Unit 1A
- 1233 Middle Gulf Dr
- 1246 Fulgur St Unit 202
- 1246 Fulgur St Unit 608
- 1246 Fulgur St Unit 112
- 1246 Fulgur St Unit 105
- 1246 Fulgur St Unit 401
- 1390 Middle Gulf Dr Unit E
- 1234 Middle Gulf Dr
- 1199 Par View Dr
- 1401 Middle Gulf Dr Unit 303O
- 1401 Middle Gulf Dr Unit O206
- 1401 Middle Gulf Dr Unit L405
- 1401 Middle Gulf Dr Unit 204T
- 1340 Middle Gulf Dr Unit 7C
- 1340 Middle Gulf Dr Unit 6B
- 1340 Middle Gulf Dr Unit 9C
- 1340 Middle Gulf Dr Unit 7A
- 1340 Middle Gulf Dr Unit 9D
- 1340 Middle Gulf Dr Unit 7B
- 1340 Middle Gulf Dr Unit 8B
- 1340 Middle Gulf Dr Unit 8A
- 1340 Middle Gulf Dr Unit 6C
- 1340 Middle Gulf Dr Unit 9A
- 1340 Middle Gulf Dr Unit 8D
- 1340 Middle Gulf Dr Unit 6D
- 1340 Middle Gulf Dr Unit 8C
- 1340 Middle Gulf Dr Unit 6A
- 1299 Middle Gulf Dr Unit A102
- 1299 Middle Gulf Dr Unit A153
- 1299 Middle Gulf Dr Unit A103
- 1299 Middle Gulf Dr Unit A182
- 1299 Middle Gulf Dr Unit A163
- 1299 Middle Gulf Dr Unit A143