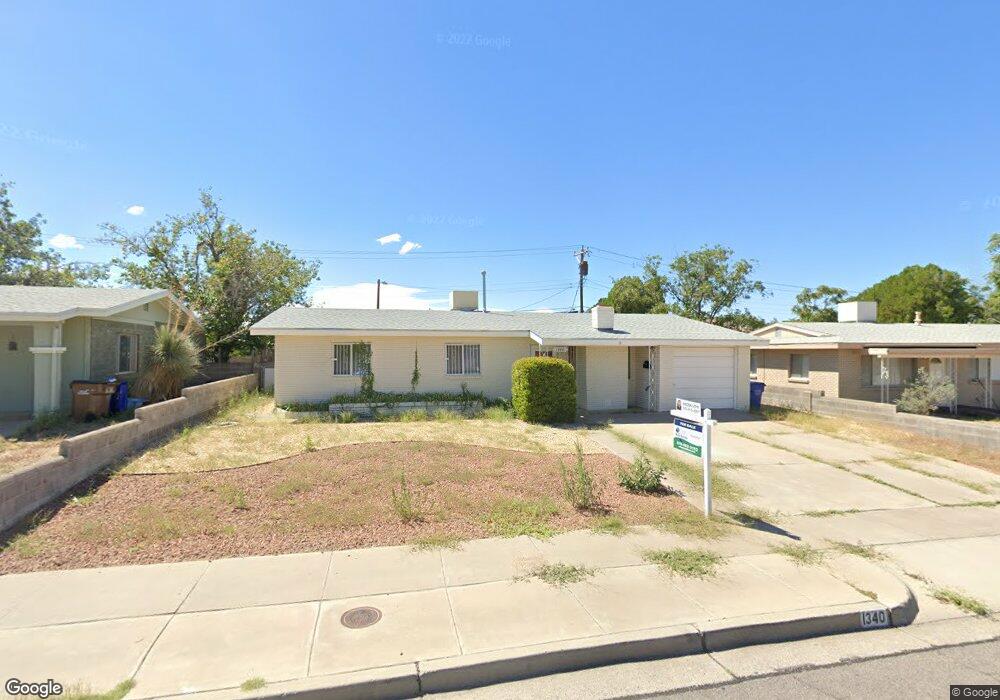
1340 Myrtle Ave Las Cruces, NM 88001
Estimated Value: $194,000 - $203,670
3
Beds
2
Baths
1,248
Sq Ft
$159/Sq Ft
Est. Value
About This Home
This home is located at 1340 Myrtle Ave, Las Cruces, NM 88001 and is currently estimated at $198,835, approximately $159 per square foot. 1340 Myrtle Ave is a home located in Dona Ana County with nearby schools including University Hills Elementary School, Lynn Middle School, and Centennial High School.
Ownership History
Date
Name
Owned For
Owner Type
Purchase Details
Closed on
Jan 2, 2025
Sold by
Gorham Melissa Y and Henderson Melissa Y
Bought by
Hood Austin Joe
Current Estimated Value
Home Financials for this Owner
Home Financials are based on the most recent Mortgage that was taken out on this home.
Original Mortgage
$181,649
Outstanding Balance
$180,395
Interest Rate
6.84%
Mortgage Type
FHA
Estimated Equity
$18,440
Purchase Details
Closed on
Dec 16, 2004
Sold by
Winans Francis N and Winans Celia M
Bought by
Winans Francis N and Winans Celia M
Purchase Details
Closed on
Sep 10, 2004
Sold by
Winans Francis N and Winans Fami M F
Bought by
Gorham Melissa Y
Home Financials for this Owner
Home Financials are based on the most recent Mortgage that was taken out on this home.
Original Mortgage
$60,750
Interest Rate
3.65%
Mortgage Type
New Conventional
Create a Home Valuation Report for This Property
The Home Valuation Report is an in-depth analysis detailing your home's value as well as a comparison with similar homes in the area
Home Values in the Area
Average Home Value in this Area
Purchase History
| Date | Buyer | Sale Price | Title Company |
|---|---|---|---|
| Hood Austin Joe | -- | Southwestern Abstract & Title | |
| Hood Austin Joe | -- | Southwestern Abstract & Title | |
| Winans Francis N | -- | -- | |
| Gorham Melissa Y | -- | Southwestern Abstract & Titl |
Source: Public Records
Mortgage History
| Date | Status | Borrower | Loan Amount |
|---|---|---|---|
| Open | Hood Austin Joe | $181,649 | |
| Closed | Hood Austin Joe | $181,649 | |
| Previous Owner | Gorham Melissa Y | $60,750 |
Source: Public Records
Tax History Compared to Growth
Tax History
| Year | Tax Paid | Tax Assessment Tax Assessment Total Assessment is a certain percentage of the fair market value that is determined by local assessors to be the total taxable value of land and additions on the property. | Land | Improvement |
|---|---|---|---|---|
| 2024 | $997 | $32,747 | $8,333 | $24,414 |
| 2023 | $983 | $31,793 | $8,333 | $23,460 |
| 2022 | $968 | $30,867 | $8,333 | $22,534 |
| 2021 | $937 | $29,968 | $8,333 | $21,635 |
| 2020 | $914 | $29,095 | $8,333 | $20,762 |
| 2019 | $890 | $28,248 | $8,333 | $19,915 |
| 2018 | $859 | $27,425 | $8,333 | $19,092 |
| 2017 | $789 | $27,433 | $8,333 | $19,100 |
| 2016 | $532 | $24,259 | $4,517 | $19,742 |
| 2015 | $514 | $70,656 | $13,155 | $57,501 |
| 2014 | $247 | $68,598 | $12,772 | $55,826 |
Source: Public Records
Map
Nearby Homes
- 1350 Wofford Dr
- 1825 Chaparro St
- 2105 S Espina St
- 1423 -1425 Monte Vista Ave
- 1630 Wyoming Ave
- 1101 Jett Ave
- 1512 Andrews Dr
- 1880 Rentfrow Ave
- 1782 Pecos St
- 2306 S Espina St
- 1755 Walden Dr
- 1935 Thomas Dr
- 1491 Alamo St Unit D
- 1424 Thomas Dr
- 2050 Crescent Dr
- 1640 E Idaho Ave
- 1401 Alamo St Unit B
- 2090 Payne Ct
- 1408 Lees Dr
- 1229 S Espanola St
- 1350 Myrtle Ave
- 1330 Myrtle Ave
- 1400 Myrtle Ave
- 1320 Myrtle Ave
- 1355 Myrtle Ave
- 1345 Myrtle Ave
- 1335 Myrtle Ave
- 1365 Myrtle Ave
- 1310 Myrtle Ave
- 1395 Panlener Ave
- 1325 Myrtle Ave
- 1405 Myrtle Ave
- 1300 Myrtle Ave
- 2020 Lynch Dr
- 1420 Myrtle Ave
- 1315 Myrtle Ave
- 1415 Myrtle Ave
- 2030 Lynch Dr
- 1340 Wofford Dr
- 1360 Wofford Dr