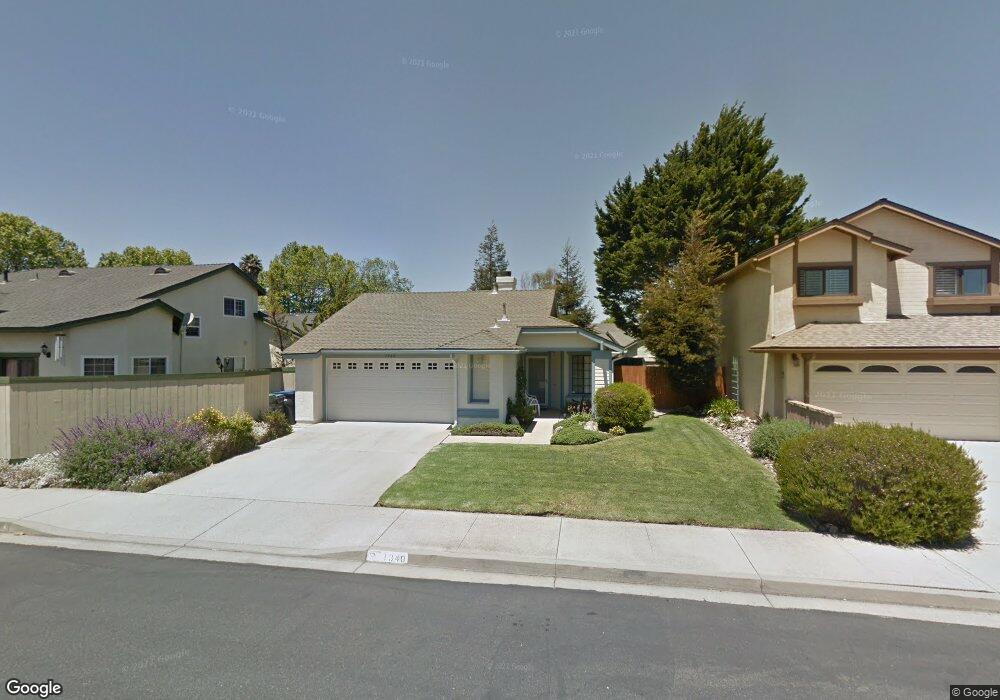
1340 Village Meadows Dr Lompoc, CA 93436
West Lompoc NeighborhoodEstimated Value: $526,701 - $594,000
3
Beds
2
Baths
1,225
Sq Ft
$449/Sq Ft
Est. Value
About This Home
This home is located at 1340 Village Meadows Dr, Lompoc, CA 93436 and is currently estimated at $549,925, approximately $448 per square foot. 1340 Village Meadows Dr is a home located in Santa Barbara County with nearby schools including La Canada Elementary School, Lompoc Valley Middle School, and Lompoc High School.
Ownership History
Date
Name
Owned For
Owner Type
Purchase Details
Closed on
Aug 12, 2015
Sold by
Morelock Robin
Bought by
The Kenneth & Robin Morelock Trust and Morelock Robin Louise
Current Estimated Value
Purchase Details
Closed on
May 12, 2014
Sold by
English Daniel
Bought by
Morelock Robin
Purchase Details
Closed on
May 1, 2000
Sold by
English Edna M
Bought by
English Edna Mae
Purchase Details
Closed on
Mar 16, 2000
Sold by
Peck Patricia Ann Trustee Tr 11-27-74
Bought by
English Edna M
Purchase Details
Closed on
Feb 15, 1994
Sold by
Galloway Jeffrey C and Galloway Jane E
Bought by
Peck John R and Peck Patricia A
Home Financials for this Owner
Home Financials are based on the most recent Mortgage that was taken out on this home.
Original Mortgage
$89,950
Interest Rate
7%
Create a Home Valuation Report for This Property
The Home Valuation Report is an in-depth analysis detailing your home's value as well as a comparison with similar homes in the area
Home Values in the Area
Average Home Value in this Area
Purchase History
| Date | Buyer | Sale Price | Title Company |
|---|---|---|---|
| The Kenneth & Robin Morelock Trust | -- | None Available | |
| Morelock Robin | -- | None Available | |
| English Edna Mae | -- | -- | |
| English Edna M | $166,000 | Chicago Title Co | |
| Peck John R | $128,500 | Chicago Title Company |
Source: Public Records
Mortgage History
| Date | Status | Borrower | Loan Amount |
|---|---|---|---|
| Previous Owner | Peck John R | $89,950 |
Source: Public Records
Tax History Compared to Growth
Tax History
| Year | Tax Paid | Tax Assessment Tax Assessment Total Assessment is a certain percentage of the fair market value that is determined by local assessors to be the total taxable value of land and additions on the property. | Land | Improvement |
|---|---|---|---|---|
| 2025 | $2,801 | $255,114 | $92,205 | $162,909 |
| 2023 | $2,801 | $245,210 | $88,626 | $156,584 |
| 2022 | $2,752 | $240,403 | $86,889 | $153,514 |
| 2021 | $2,782 | $235,690 | $85,186 | $150,504 |
| 2020 | $2,753 | $233,274 | $84,313 | $148,961 |
| 2019 | $2,707 | $228,701 | $82,660 | $146,041 |
| 2018 | $2,666 | $224,218 | $81,040 | $143,178 |
| 2017 | $2,617 | $219,822 | $79,451 | $140,371 |
| 2016 | $2,570 | $215,513 | $77,894 | $137,619 |
| 2015 | $2,551 | $212,276 | $76,724 | $135,552 |
| 2014 | $2,515 | $208,119 | $75,222 | $132,897 |
Source: Public Records
Map
Nearby Homes
- 1121 Bellflower Ln
- 1236 Jason Dr
- 1320 Stonebrook Dr
- 1265 Stonebrook Dr
- 1241 Stonebrook Dr
- 1429 Glen Ellen Ln
- 1317 N V St Unit 182
- 1317 N V St Unit 76
- 906 N P St
- 321 W North Ave Unit 49
- 1407 N H St
- 905 N L St
- 100 California 1
- 816 N O St Unit 113
- 1006 Tranquillion Ct
- 1104 Honda Way
- 1213 Meridian Way
- 1212 W Prune Ave
- 531 N O St
- 1209 N B St
- 1304 Aster Ln
- 1308 Aster Ln
- 1341 Camellia Ct
- 1345 Camellia Ct
- 1337 Camellia Ct
- 1312 Aster Ln
- 1337 Cimellia Ct
- 1341 Village Meadows Dr
- 1328 Village Meadows Dr
- 1345 Village Meadows Dr
- 1337 Village Meadows Dr
- 1349 Camellia Ct
- 1240 Aster Ln
- 1316 Aster Ln
- 1333 Village Meadows Dr
- 1353 Camellia Ct
- 1305 Aster Ln