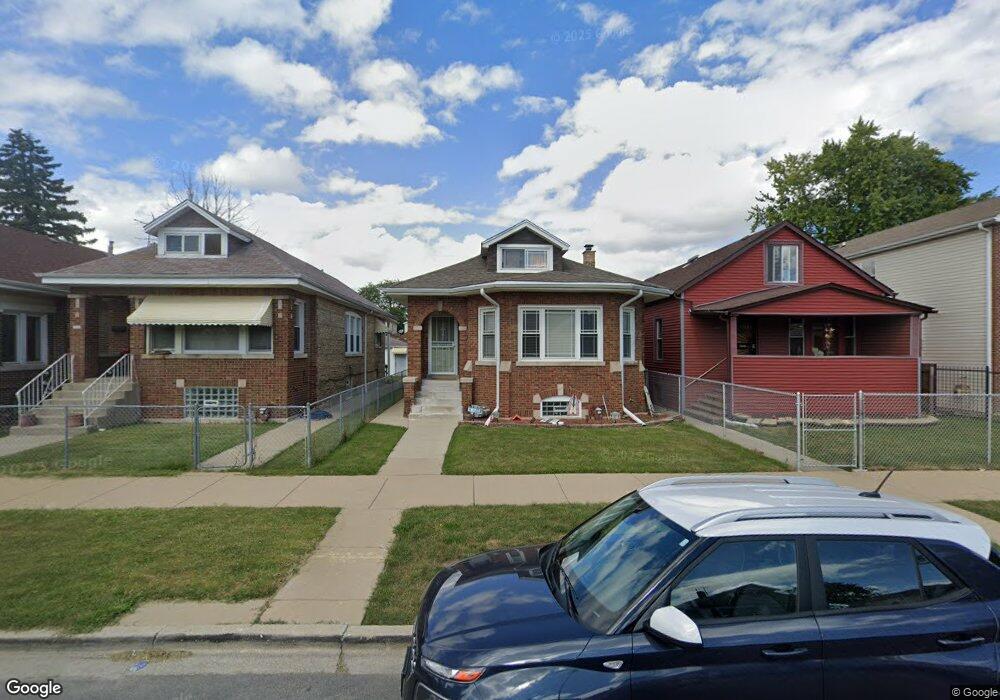
1340 W 98th St Chicago, IL 60643
Washington Heights NeighborhoodEstimated Value: $209,000 - $347,000
4
Beds
3
Baths
1,456
Sq Ft
$179/Sq Ft
Est. Value
About This Home
This home is located at 1340 W 98th St, Chicago, IL 60643 and is currently estimated at $261,221, approximately $179 per square foot. 1340 W 98th St is a home located in Cook County with nearby schools including Green W Elementary School, Corliss High School, and CICS - Longwood Campus.
Ownership History
Date
Name
Owned For
Owner Type
Purchase Details
Closed on
May 13, 2011
Sold by
J K O Properties Llc
Bought by
Graham Cheryl D
Current Estimated Value
Home Financials for this Owner
Home Financials are based on the most recent Mortgage that was taken out on this home.
Original Mortgage
$174,462
Interest Rate
5.12%
Mortgage Type
FHA
Purchase Details
Closed on
Oct 13, 2010
Sold by
Hsbc Bank Usa Na
Bought by
J K O Properties Llc
Purchase Details
Closed on
Jul 20, 2010
Sold by
Steele Laura and Cobbins Jacqueline
Bought by
Hsbc Bank Usa Na
Purchase Details
Closed on
May 18, 2007
Sold by
Steele Laura
Bought by
Steele Laura and Steele Donald
Home Financials for this Owner
Home Financials are based on the most recent Mortgage that was taken out on this home.
Original Mortgage
$125,000
Interest Rate
6.47%
Mortgage Type
New Conventional
Create a Home Valuation Report for This Property
The Home Valuation Report is an in-depth analysis detailing your home's value as well as a comparison with similar homes in the area
Home Values in the Area
Average Home Value in this Area
Purchase History
| Date | Buyer | Sale Price | Title Company |
|---|---|---|---|
| Graham Cheryl D | $179,000 | Cst | |
| J K O Properties Llc | $57,500 | Fidelity National Title | |
| Hsbc Bank Usa Na | -- | None Available | |
| Steele Laura | -- | Accommodation |
Source: Public Records
Mortgage History
| Date | Status | Borrower | Loan Amount |
|---|---|---|---|
| Previous Owner | Graham Cheryl D | $174,462 | |
| Previous Owner | Steele Laura | $125,000 |
Source: Public Records
Tax History Compared to Growth
Tax History
| Year | Tax Paid | Tax Assessment Tax Assessment Total Assessment is a certain percentage of the fair market value that is determined by local assessors to be the total taxable value of land and additions on the property. | Land | Improvement |
|---|---|---|---|---|
| 2024 | $2,415 | $18,000 | $3,887 | $14,113 |
| 2023 | $2,334 | $14,732 | $3,069 | $11,663 |
| 2022 | $2,334 | $14,732 | $3,069 | $11,663 |
| 2021 | $2,958 | $18,000 | $3,069 | $14,931 |
| 2020 | $1,262 | $8,753 | $3,069 | $5,684 |
| 2019 | $1,247 | $9,619 | $3,069 | $6,550 |
| 2018 | $1,225 | $9,619 | $3,069 | $6,550 |
| 2017 | $2,783 | $16,276 | $2,659 | $13,617 |
| 2016 | $2,766 | $16,276 | $2,659 | $13,617 |
| 2015 | $2,508 | $16,276 | $2,659 | $13,617 |
| 2014 | $2,379 | $12,791 | $2,455 | $10,336 |
| 2013 | $2,332 | $12,791 | $2,455 | $10,336 |
Source: Public Records
Map
Nearby Homes
- 1328 W 98th St
- 1302 W 98th Place
- 9834 S Throop St
- 1341 W 97th St
- 9745 S Beverly Blvd
- 9838 S Beverly Ave
- 9636 S Bishop St
- 9969 S Winston Ave
- 1205 W 97th St
- 9976 S Winston Ave
- 1235 W 96th St
- 9609 S Winston Ave
- 1218 W 96th St
- 1212 W 96th St
- 1221 W 95th Place
- 9856 S Prospect Ave
- 9944 S Prospect Ave
- 10152 S Winston Ave
- 10116 S Malta St
- 9815 S Carpenter St
- 1344 W 98th St
- 1338 W 98th St
- 1348 W 98th St
- 1334 W 98th St
- 1332 W 98th St
- 1350 W 98th St
- 1354 W 98th St
- 1326 W 98th St
- 1343 W 97th Place
- 1347 W 97th Place
- 1339 W 97th Place
- 1335 W 97th Place
- 1349 W 97th Place
- 1322 W 98th St
- 1333 W 97th Place
- 1351 W 97th Place
- 1341 W 98th St
- 1345 W 98th St
- 1339 W 98th St
- 1329 W 97th Place