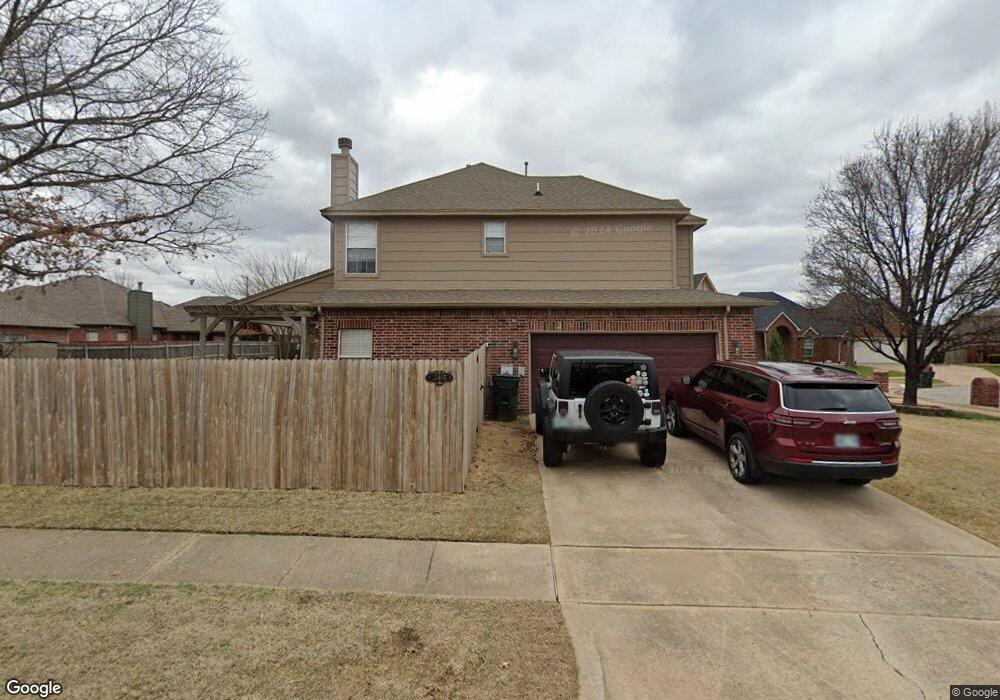
13405 E 90th St N Owasso, OK 74055
Estimated Value: $350,227 - $381,000
4
Beds
3
Baths
2,615
Sq Ft
$142/Sq Ft
Est. Value
About This Home
This home is located at 13405 E 90th St N, Owasso, OK 74055 and is currently estimated at $370,807, approximately $141 per square foot. 13405 E 90th St N is a home located in Tulsa County with nearby schools including Hayward Smith Elementary School, Owasso 6th Grade Center, and Owasso 8th Grade Center.
Ownership History
Date
Name
Owned For
Owner Type
Purchase Details
Closed on
Mar 25, 2011
Sold by
Thornton Jennifer L and Thornton Rodney C
Bought by
Cohen Michael D and Cohen Kimberly D
Current Estimated Value
Home Financials for this Owner
Home Financials are based on the most recent Mortgage that was taken out on this home.
Original Mortgage
$170,000
Outstanding Balance
$117,330
Interest Rate
5.04%
Mortgage Type
VA
Estimated Equity
$253,477
Purchase Details
Closed on
Mar 24, 2005
Sold by
White Mary E and Wuest Mary E
Bought by
Thornton Rodney C and Thornton Jennifer L
Purchase Details
Closed on
Feb 2, 2004
Sold by
White Robert H
Bought by
White Mary E
Purchase Details
Closed on
Mar 31, 2000
Sold by
Premier Homes Inc
Bought by
White Robert H and Wuest Mary E
Create a Home Valuation Report for This Property
The Home Valuation Report is an in-depth analysis detailing your home's value as well as a comparison with similar homes in the area
Home Values in the Area
Average Home Value in this Area
Purchase History
| Date | Buyer | Sale Price | Title Company |
|---|---|---|---|
| Cohen Michael D | $190,000 | Multiple | |
| Thornton Rodney C | $185,000 | The Executives Title & Escro | |
| White Mary E | -- | -- | |
| White Robert H | $161,500 | Delta Title & Escrow Company |
Source: Public Records
Mortgage History
| Date | Status | Borrower | Loan Amount |
|---|---|---|---|
| Open | Cohen Michael D | $170,000 |
Source: Public Records
Tax History
| Year | Tax Paid | Tax Assessment Tax Assessment Total Assessment is a certain percentage of the fair market value that is determined by local assessors to be the total taxable value of land and additions on the property. | Land | Improvement |
|---|---|---|---|---|
| 2025 | $2,538 | $22,524 | $1,532 | $20,992 |
| 2024 | $2,304 | $21,838 | $1,533 | $20,305 |
| 2023 | $2,304 | $22,172 | $1,596 | $20,576 |
| 2022 | $2,333 | $20,527 | $2,311 | $18,216 |
| 2021 | $2,239 | $19,900 | $2,409 | $17,491 |
| 2020 | $2,239 | $19,900 | $2,409 | $17,491 |
| 2019 | $2,229 | $19,900 | $2,409 | $17,491 |
| 2018 | $2,159 | $19,900 | $2,409 | $17,491 |
| 2017 | $2,166 | $20,900 | $2,530 | $18,370 |
| 2016 | $2,174 | $20,900 | $2,530 | $18,370 |
| 2015 | $2,191 | $20,900 | $2,530 | $18,370 |
| 2014 | $2,211 | $20,900 | $2,530 | $18,370 |
Source: Public Records
Map
Nearby Homes
- 9001 N 137th East Ave
- 9225 N 133rd East Ave
- 8949 N 139th East Ave
- 9124 N 138th East Ave
- 13207 E 93rd St N
- 11406 E 93rd Place N
- 8202 N 150th East Ave
- 13812 E 87th St N
- 8702 N 140th East Terrace
- 9400 N 138th East Ave
- 9218 N 141st East Ave
- 8709 N 125th East Ave
- 14119 E 88th St N
- 11599 E 96th St N
- 0 96 St N Unit 2536799
- 8709 N 124th East Ave
- 14309 E 88th Terrace N
- 9502 N 143rd East Ct
- 9220 N 144th East Ave
- 14440 E 94th St N
- 9001 N 134th East Ave
- 9005 N 134th Ave E
- 9005 N 134th East Ave
- 13410 E 90th St N
- 13412 E 90th St N
- 13413 E 90th St N
- 13406 E 90th St N
- 9009 N 134th East Ave
- 13414 E 90th St N
- 13402 E 90th St N
- 13418 E 90th St N
- 13405 E 91st St N
- 13417 E 90th St N
- 13422 E 90th St N
- 13409 E 91st St N
- 9002 N 134th East Ave
- 13409 E 89th Place N
- 9004 N 134th East Ave
- 13405 E 89th Place N
- 8918 N 134th East Ave
Your Personal Tour Guide
Ask me questions while you tour the home.