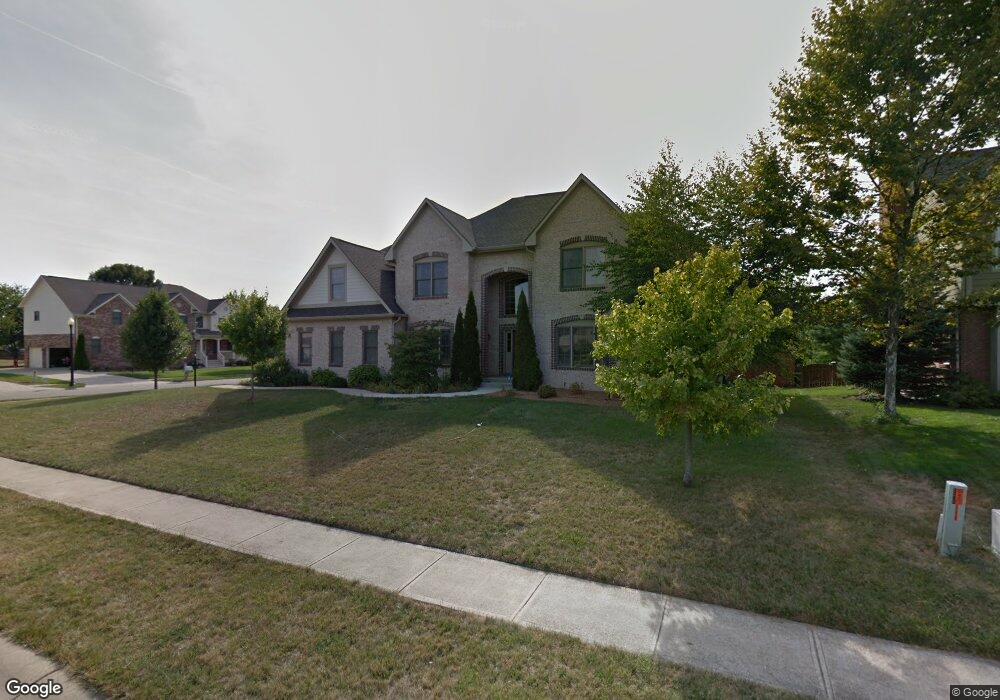
13408 Grapevine Ln Fishers, IN 46038
Estimated Value: $483,000 - $605,801
3
Beds
4
Baths
3,039
Sq Ft
$180/Sq Ft
Est. Value
About This Home
This home is located at 13408 Grapevine Ln, Fishers, IN 46038 and is currently estimated at $546,700, approximately $179 per square foot. 13408 Grapevine Ln is a home located in Hamilton County with nearby schools including Cumberland Road Elementary School, East Middle School, and Fishers Junior High School.
Ownership History
Date
Name
Owned For
Owner Type
Purchase Details
Closed on
Aug 5, 2009
Sold by
Trueblood Lea M
Bought by
Trueblood J D and Trueblood Lea M
Current Estimated Value
Home Financials for this Owner
Home Financials are based on the most recent Mortgage that was taken out on this home.
Original Mortgage
$286,000
Outstanding Balance
$187,233
Interest Rate
5.29%
Mortgage Type
New Conventional
Estimated Equity
$359,467
Purchase Details
Closed on
Jan 26, 2004
Sold by
Mann Properties Llp
Bought by
Trueblood J D J and Trueblood Lea
Home Financials for this Owner
Home Financials are based on the most recent Mortgage that was taken out on this home.
Original Mortgage
$319,500
Interest Rate
4.75%
Mortgage Type
Construction
Create a Home Valuation Report for This Property
The Home Valuation Report is an in-depth analysis detailing your home's value as well as a comparison with similar homes in the area
Home Values in the Area
Average Home Value in this Area
Purchase History
| Date | Buyer | Sale Price | Title Company |
|---|---|---|---|
| Trueblood J D | -- | None Available | |
| Trueblood Lea M | -- | None Available | |
| Trueblood J D J | -- | -- |
Source: Public Records
Mortgage History
| Date | Status | Borrower | Loan Amount |
|---|---|---|---|
| Open | Trueblood Lea M | $286,000 | |
| Closed | Trueblood J D J | $319,500 |
Source: Public Records
Tax History Compared to Growth
Tax History
| Year | Tax Paid | Tax Assessment Tax Assessment Total Assessment is a certain percentage of the fair market value that is determined by local assessors to be the total taxable value of land and additions on the property. | Land | Improvement |
|---|---|---|---|---|
| 2024 | $5,870 | $517,300 | $89,000 | $428,300 |
| 2023 | $5,905 | $506,900 | $89,000 | $417,900 |
| 2022 | $5,315 | $444,500 | $89,000 | $355,500 |
| 2021 | $4,659 | $387,000 | $89,000 | $298,000 |
| 2020 | $4,576 | $378,900 | $89,000 | $289,900 |
| 2019 | $4,481 | $371,200 | $77,900 | $293,300 |
| 2018 | $4,523 | $374,500 | $77,900 | $296,600 |
| 2017 | $4,435 | $373,500 | $77,900 | $295,600 |
| 2016 | $4,330 | $365,100 | $77,900 | $287,200 |
| 2014 | $3,671 | $338,000 | $77,900 | $260,100 |
| 2013 | $3,671 | $340,800 | $77,900 | $262,900 |
Source: Public Records
Map
Nearby Homes
- 10175 Pamona Ct
- 10523 Hollowood Ct
- 10150 Beresford Ct
- 13125 Zinfandel Place
- 13068 Lamarque Place
- 10093 Parkshore Dr
- 13048 Ross Crossing
- 13763 Meadow Lake Dr
- 12966 Pleasant View Ln
- 11798 & 11842 E 131st St
- 10713 Summerwood Ln
- 10671 Pleasant View Ln
- 10055 Plantana Blvd
- 9887 Cranberry Cir
- 14041 Mimosa Ct
- 13281 Middlewood Ln
- 12991 Wingstem Ct
- 10066 Perlita Place
- 10343 Waveland Cir
- 13853 Oak Grove Ct
- 13428 Grapevine Ln
- 10360 Creektree Ln
- 10220 Creektree Ln
- 10400 Creektree Ln
- 10381 Creektree Ln
- 13448 Grapevine Ln
- 10229 Creektree Ln
- 10204 Creektree Ln
- 10393 Hollowood Ct
- 10401 Creektree Ln
- 10420 Creektree Ln
- 10219 Creektree Ln
- 10202 Creektree Ln
- 13468 Grapevine Ln
- 10433 Hollowood Ct
- 10421 Creektree Ln
- 10209 Creektree Ln
- 10205 Pamona Ct
- 10228 Talladega Ct
- 10215 Pamona Ct