Estimated Value: $511,569 - $584,000
3
Beds
2
Baths
1,331
Sq Ft
$411/Sq Ft
Est. Value
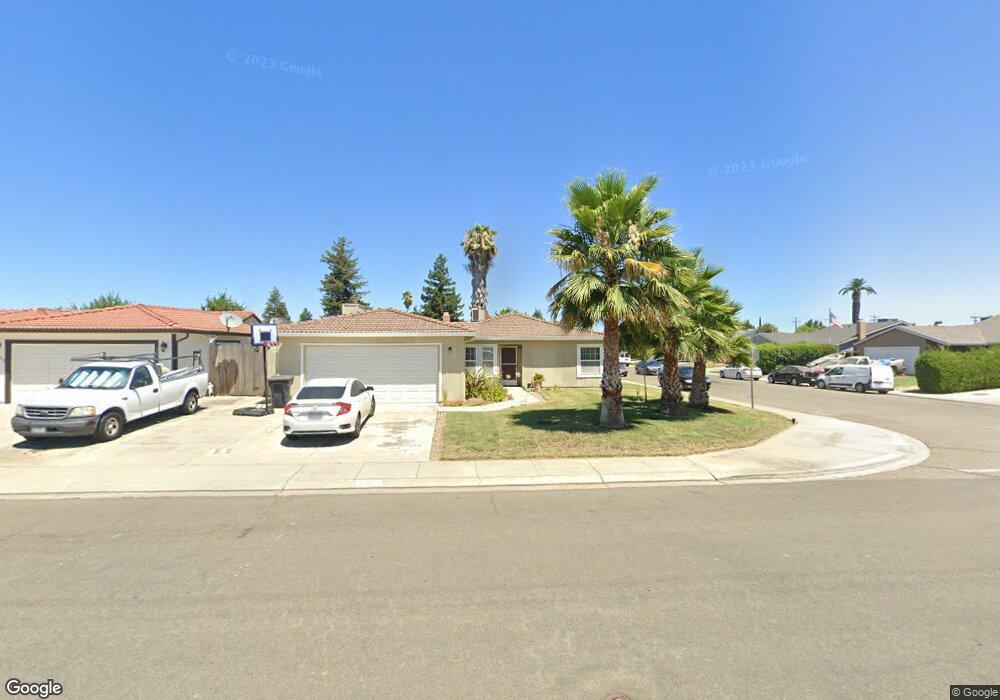
About This Home
This home is located at 1341 7th St, Ripon, CA 95366 and is currently estimated at $547,642, approximately $411 per square foot. 1341 7th St is a home located in San Joaquin County with nearby schools including Weston Elementary School, Ripon Elementary School, and Park View Elementary School.
Ownership History
Date
Name
Owned For
Owner Type
Purchase Details
Closed on
Nov 17, 1994
Sold by
Garedakis Manos A and Garedakis Helen
Bought by
Madrigal Arnoldo and Madrigal Carmen
Current Estimated Value
Home Financials for this Owner
Home Financials are based on the most recent Mortgage that was taken out on this home.
Original Mortgage
$103,500
Outstanding Balance
$59,332
Interest Rate
8.91%
Estimated Equity
$488,310
Create a Home Valuation Report for This Property
The Home Valuation Report is an in-depth analysis detailing your home's value as well as a comparison with similar homes in the area
Home Values in the Area
Average Home Value in this Area
Purchase History
| Date | Buyer | Sale Price | Title Company |
|---|---|---|---|
| Madrigal Arnoldo | $115,000 | Chicago Title Company |
Source: Public Records
Mortgage History
| Date | Status | Borrower | Loan Amount |
|---|---|---|---|
| Open | Madrigal Arnoldo | $103,500 |
Source: Public Records
Tax History
| Year | Tax Paid | Tax Assessment Tax Assessment Total Assessment is a certain percentage of the fair market value that is determined by local assessors to be the total taxable value of land and additions on the property. | Land | Improvement |
|---|---|---|---|---|
| 2025 | $2,082 | $193,139 | $83,973 | $109,166 |
| 2024 | $2,047 | $189,353 | $82,327 | $107,026 |
| 2023 | $2,005 | $185,641 | $80,713 | $104,928 |
| 2022 | $1,972 | $182,002 | $79,131 | $102,871 |
| 2021 | $1,941 | $178,434 | $77,580 | $100,854 |
| 2020 | $1,923 | $176,605 | $76,785 | $99,820 |
| 2019 | $1,889 | $173,143 | $75,280 | $97,863 |
| 2018 | $1,859 | $169,749 | $73,804 | $95,945 |
| 2017 | $1,823 | $166,421 | $72,357 | $94,064 |
| 2016 | $1,792 | $163,159 | $70,939 | $92,220 |
| 2015 | $1,769 | $160,708 | $69,873 | $90,835 |
| 2014 | $1,723 | $157,561 | $68,505 | $89,056 |
Source: Public Records
Map
Nearby Homes
- 924 Kingery Dr
- 1315 Augusta Pointe Dr
- 1122 Zumstein Ct
- 1434 Augusta Pointe Dr
- 916 6th St
- 1601 Stanley Dr
- 23811 S Jack Tone Rd
- 1672 Bailey Dr
- 1080 Ruess Rd
- 1621 Davis St
- 1691 Davis St
- 138 Roxie Ct
- 602 S Highland Ave
- 336 Kristen Way
- 1191 S Mohler Rd
- 1187 S Mohler Rd
- 205 3rd St
- 150 N Acacia Ave
- 547 Sepp Ct
- 410 Pine St
Your Personal Tour Guide
Ask me questions while you tour the home.