


About 1341 Cook
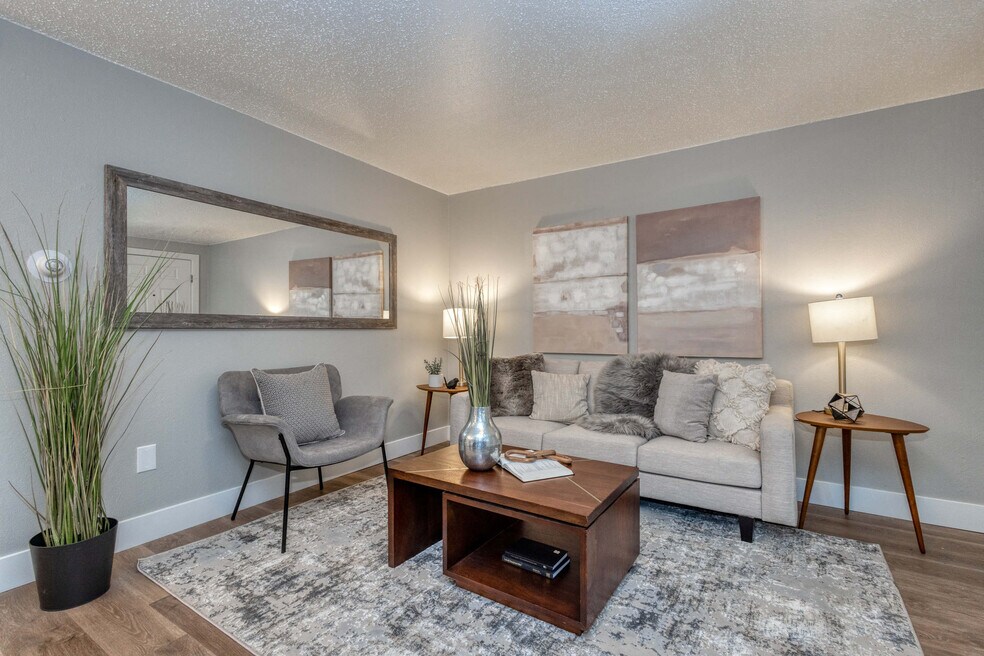
Welcome to 1341 Cook! Located just three miles east of Downtown Denver, Congress Park offers plenty of residential charm with historic homes situated along tree-lined streets. Congress Park residents enjoy access to an array of diverse eateries, eclectic bars, and independent shops strewn along Colfax as well as numerous recreational opportunities at City and Congress Park. These one and two-bedroom apartments have wood-style flooring, air-conditioning, on-site laundry, reserved parking**, and a community courtyard ideal for entertaining friends and neighbors.

Pricing and Floor Plans
No units available at this time.
Fees and Policies
The fees below are based on community-supplied data and may exclude additional fees and utilities.Utilities And Essentials
One-Time Basics
Due at ApplicationParking
Pets
Personal Add-Ons
Situational
Property Fee Disclaimer: Standard Security Deposit subject to change based on screening results; total security deposit(s) will not exceed any legal maximum. Resident may be responsible for maintaining insurance pursuant to the Lease. Some fees may not apply to apartment homes subject to an affordable program. Resident is responsible for damages that exceed ordinary wear and tear. Some items may be taxed under applicable law. This form does not modify the lease. Additional fees may apply in specific situations as detailed in the application and/or lease agreement, which can be requested prior to the application process. All fees are subject to the terms of the application and/or lease. Residents may be responsible for activating and maintaining utility services, including but not limited to electricity, water, gas, and internet, as specified in the lease agreement.
Map
- 1331 Cook St
- 1370 Adams St
- 1313 Steele St Unit 702
- 1327 Steele St Unit 102
- 1406 Madison St Unit 1408
- 1367 Monroe St
- 1435 Adams St
- 1417 Monroe St
- 1217 Monroe St
- 1201 Steele St
- 1488 Madison St Unit 102
- 1488 Madison St Unit 307
- 1324 Garfield St
- 1489 Steele St Unit 104
- 1489 Steele St Unit 201
- 1366 Garfield St Unit 505
- 1366 Garfield St Unit 209
- 1260 Garfield St
- 1106 Steele St
- 1070 Cook St Unit 1072
- 1325 S Garfield St
- 1315 Jackson St
- 1252 Fillmore St
- 1401 Fillmore St Unit 5
- 1550 Milwaukee St
- 1440 Detroit St Unit 3
- 1321 Detroit St
- 1638 Adams St Unit A
- 1225 Colorado Blvd
- 1280 Clayton St
- 1451-1459 Detroit St
- 1151 Colorado Blvd
- 1250 Colorado Blvd
- 1137 Colorado Blvd
- 1200 Colorado Blvd
- 1575 Fillmore St Unit 2
- 1600 S Fillmore St
- 1280 Albion St
- 1560 Detroit St Unit C
- 1410-1430 Albion St
Ask me questions while you tour the home.