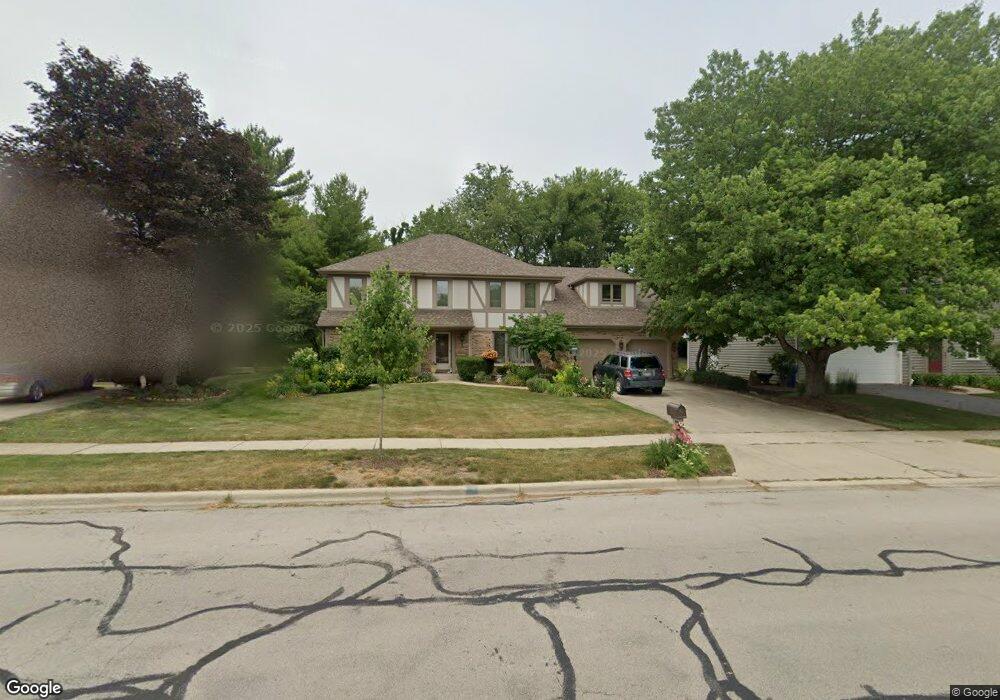
1341 E Gartner Rd Naperville, IL 60540
Huntington Hill NeighborhoodEstimated Value: $829,365 - $945,000
4
Beds
3
Baths
3,646
Sq Ft
$243/Sq Ft
Est. Value
About This Home
This home is located at 1341 E Gartner Rd, Naperville, IL 60540 and is currently estimated at $885,091, approximately $242 per square foot. 1341 E Gartner Rd is a home located in DuPage County with nearby schools including Prairie Elementary School, Washington Jr High School, and Naperville North High School.
Ownership History
Date
Name
Owned For
Owner Type
Purchase Details
Closed on
May 30, 2003
Sold by
Hua Gary X and Gao Linda Q
Bought by
Mennella Nordin David W and Mennella Nordin Mary
Current Estimated Value
Purchase Details
Closed on
May 1, 1999
Sold by
Javor Gregory J and Javor Mary C
Bought by
Hua Gary X and Gao Linda Q
Home Financials for this Owner
Home Financials are based on the most recent Mortgage that was taken out on this home.
Original Mortgage
$303,200
Interest Rate
7.37%
Purchase Details
Closed on
Oct 7, 1996
Sold by
Pollen Ronald J and Pollen Marilyn J
Bought by
Javor Gregory J and Javor Mary C
Home Financials for this Owner
Home Financials are based on the most recent Mortgage that was taken out on this home.
Original Mortgage
$282,000
Interest Rate
7.25%
Create a Home Valuation Report for This Property
The Home Valuation Report is an in-depth analysis detailing your home's value as well as a comparison with similar homes in the area
Home Values in the Area
Average Home Value in this Area
Purchase History
| Date | Buyer | Sale Price | Title Company |
|---|---|---|---|
| Mennella Nordin David W | $475,000 | Pntn | |
| Hua Gary X | $379,000 | First American Title Ins | |
| Javor Gregory J | $352,500 | -- |
Source: Public Records
Mortgage History
| Date | Status | Borrower | Loan Amount |
|---|---|---|---|
| Previous Owner | Hua Gary X | $303,200 | |
| Previous Owner | Javor Gregory J | $282,000 |
Source: Public Records
Tax History
| Year | Tax Paid | Tax Assessment Tax Assessment Total Assessment is a certain percentage of the fair market value that is determined by local assessors to be the total taxable value of land and additions on the property. | Land | Improvement |
|---|---|---|---|---|
| 2024 | $13,393 | $234,622 | $67,002 | $167,620 |
| 2023 | $12,874 | $214,130 | $61,150 | $152,980 |
| 2022 | $13,146 | $214,130 | $61,150 | $152,980 |
| 2021 | $12,659 | $206,030 | $58,840 | $147,190 |
| 2020 | $12,710 | $202,320 | $57,780 | $144,540 |
| 2019 | $12,346 | $193,570 | $55,280 | $138,290 |
| 2018 | $12,100 | $189,780 | $54,200 | $135,580 |
| 2017 | $11,862 | $183,380 | $52,370 | $131,010 |
| 2016 | $11,630 | $176,750 | $50,480 | $126,270 |
| 2015 | $12,308 | $176,740 | $50,480 | $126,260 |
| 2014 | $12,709 | $176,740 | $50,480 | $126,260 |
| 2013 | $12,517 | $177,160 | $50,600 | $126,560 |
Source: Public Records
Map
Nearby Homes
- 1386 Old Dominion Ct
- 1125 Huntleigh Dr
- 907 Secretariat Dr
- 1172 Kenilworth Cir
- 923 Tim Tam Cir
- 908 Julian Ct
- 820 Prairie Ave
- 479 S Julian St
- 616 Driftwood Ct
- 488 S Columbia St
- 2764 Weeping Willow Dr Unit A
- 8S452 Bell Dr
- 1285 Stonebriar Ct
- 915 E Chicago Ave
- 226 S Columbia St
- 706 S Loomis St Unit D
- 203 S Columbia St
- 1068 Mattande Ln
- 24W681 Woodcrest Dr
- 6385 Winstead Ct
- 1345 E Gartner Rd
- 1335 E Gartner Rd
- 1329 E Gartner Rd
- 1349 E Gartner Rd
- 616 Lynchburg Ct
- 617 Lynchburg Ct
- 612 Lynchburg Ct
- 800 Shanahan Ct
- 801 Shanahan Ct
- 1323 E Gartner Rd
- 1353 E Gartner Rd
- 1352 E Gartner Rd
- 613 Lynchburg Ct
- 608 Lynchburg Ct
- 1357 E Gartner Rd
- 1336 E Gartner Rd
- 1317 E Gartner Rd
- 1332 E Gartner Rd
- 1356 E Gartner Rd
- 609 Lynchburg Ct